29
/
en
AIzaSyAYiBZKx7MnpbEhh9jyipgxe19OcubqV5w
April 1, 2024
192540
Marshall Islands
MHL
true
2
1
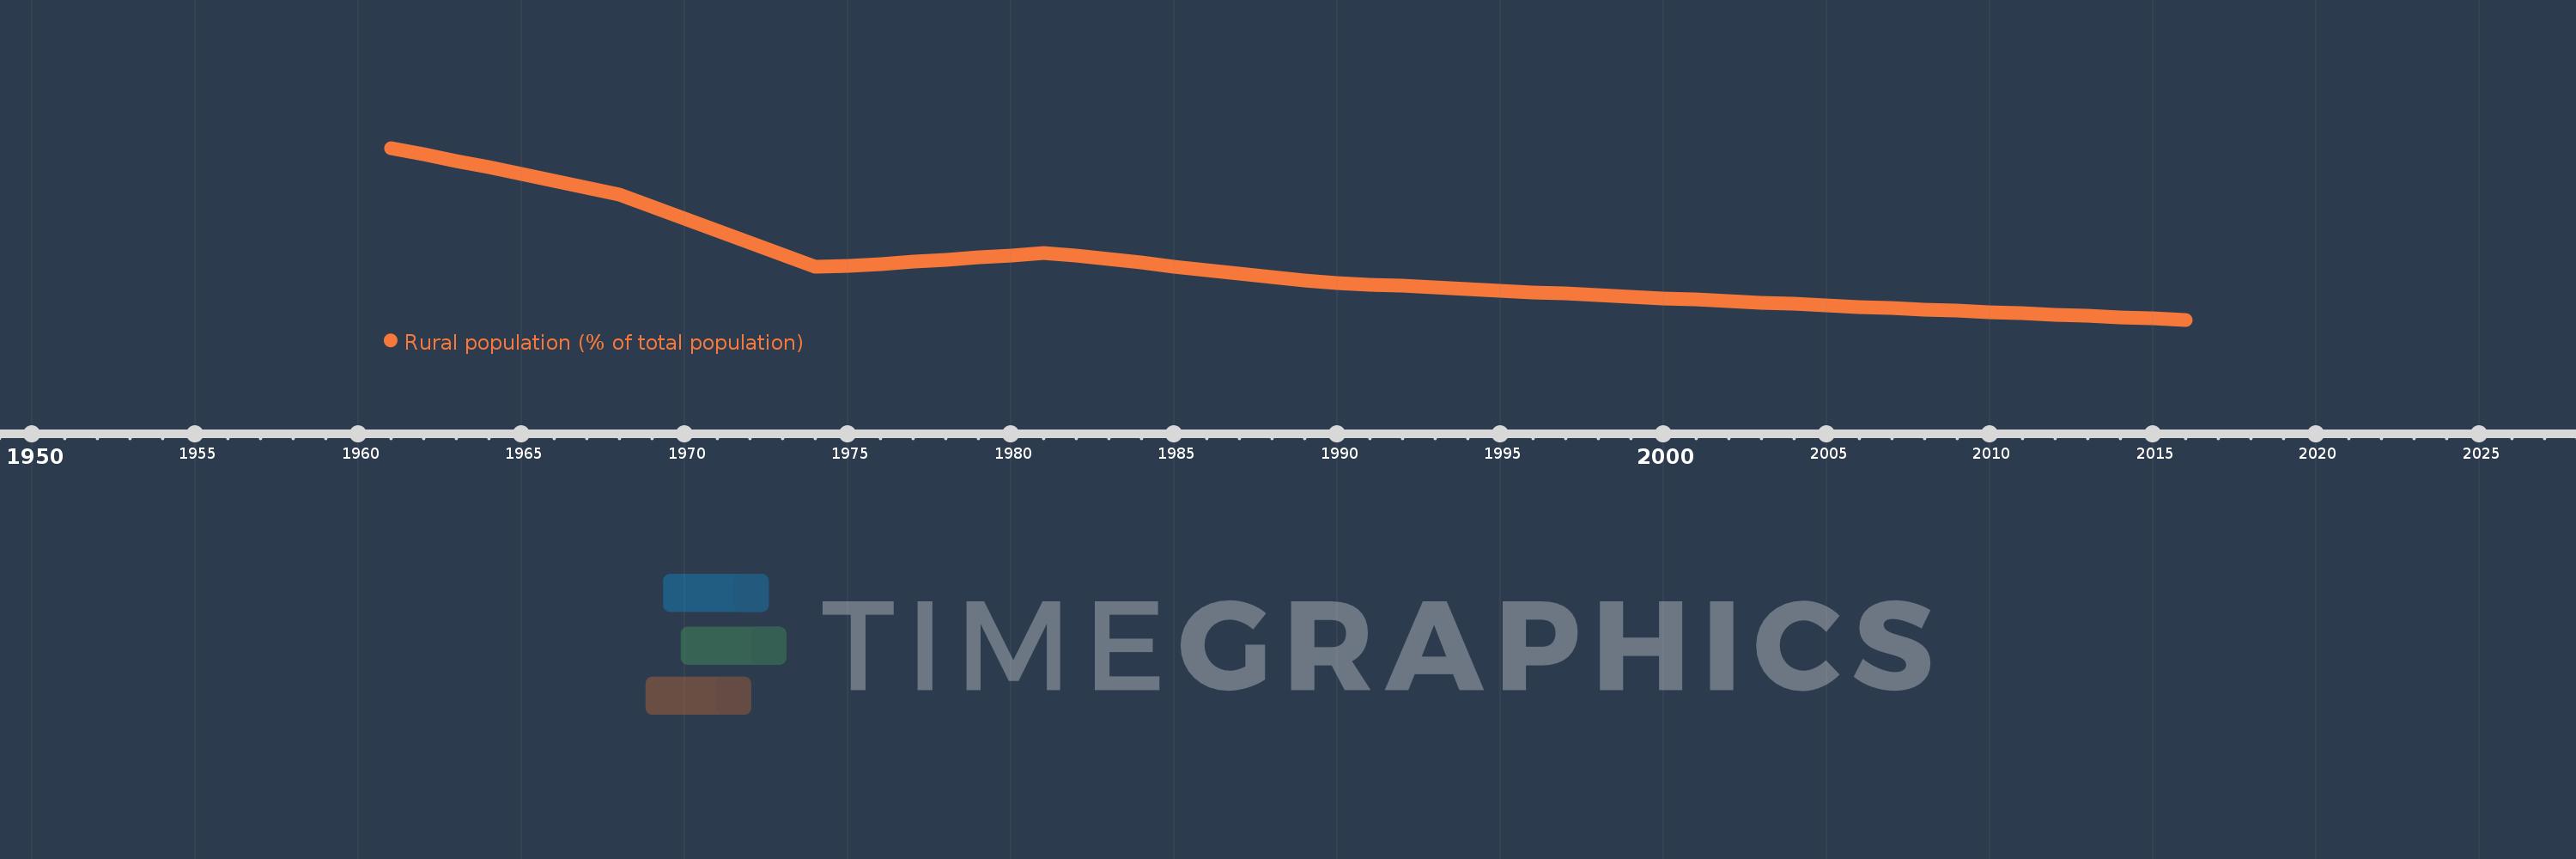
Rural population (% of total population)
2016,2015,2014,2013,2012,2011,2010,2009,2008,2007,2006,2005,2004,2003,2002,2001,2000,1999,1998,1997,1996,1995,1994,1993,1992,1991,1990,1989,1988,1987,1986,1985,1984,1983,1982,1981,1980,1979,1978,1977,1976,1975,1974,1973,1972,1971,1970,1969,1968,1967,1966,1965,1964,1963,1962,1961
This statistics in other country:
AfghanistanAlbaniaAlgeriaAmerican SamoaAndorraAngolaAntigua and BarbudaArab WorldArgentinaArmeniaArubaAustraliaAustriaAzerbaijanBahamas, TheBahrainBangladeshBarbadosBelarusBelgiumBelizeBeninBermudaBhutanBoliviaBosnia and HerzegovinaBotswanaBrazilBritish Virgin IslandsBrunei DarussalamBulgariaBurkina FasoBurundiCabo VerdeCambodiaCameroonCanadaCaribbean small statesCayman IslandsCentral African RepublicCentral Europe and the BalticsChadChannel IslandsChileChinaColombiaComorosCongo, Dem. Rep.Congo, Rep.Costa RicaCote d'IvoireCroatiaCubaCuracaoCyprusCzech RepublicDenmarkDjiboutiDominicaDominican RepublicEarly-demographic dividendEast Asia & PacificEast Asia & Pacific (excluding high income)East Asia & Pacific (IDA & IBRD countries)EcuadorEgypt, Arab Rep.El SalvadorEquatorial GuineaEritreaEstoniaEthiopiaEuro areaEurope & Central AsiaEurope & Central Asia (excluding high income)Europe & Central Asia (IDA & IBRD countries)European UnionFaroe IslandsFijiFinlandFragile and conflict affected situationsFranceFrench PolynesiaGabonGambia, TheGeorgiaGermanyGhanaGibraltarGreeceGreenlandGrenadaGuamGuatemalaGuineaGuinea-BissauGuyanaHaitiHeavily indebted poor countries (HIPC)High incomeHondurasHong Kong SAR, ChinaHungaryIBRD onlyIcelandIDA & IBRD totalIDA blendIDA onlyIDA totalIndiaIndonesiaIran, Islamic Rep.IraqIrelandIsle of ManIsraelItalyJamaicaJapanJordanKazakhstanKenyaKiribatiKorea, Dem. People’s Rep.Korea, Rep.KuwaitKyrgyz RepublicLao PDRLate-demographic dividendLatin America & Caribbean Latin America & Caribbean (excluding high income)Latin America & the Caribbean (IDA & IBRD countries)LatviaLeast developed countries: UN classificationLebanonLesothoLiberiaLibyaLiechtensteinLithuaniaLow & middle incomeLow incomeLower middle incomeLuxembourgMacao SAR, ChinaMacedonia, FYRMadagascarMalawiMalaysiaMaldivesMaliMaltaMarshall IslandsMauritaniaMauritiusMexicoMicronesia, Fed. Sts.Middle East & North AfricaMiddle East & North Africa (excluding high income)Middle East & North Africa (IDA & IBRD countries)Middle incomeMoldovaMonacoMongoliaMontenegroMoroccoMozambiqueMyanmarNamibiaNauruNepalNetherlandsNew CaledoniaNew ZealandNicaraguaNigerNigeriaNorth AmericaNorthern Mariana IslandsNorwayOECD membersOmanOther small statesPacific island small statesPakistanPalauPanamaPapua New GuineaParaguayPeruPhilippinesPolandPortugalPost-demographic dividendPre-demographic dividendPuerto RicoQatarRomaniaRussian FederationRwandaSamoaSan MarinoSao Tome and PrincipeSaudi ArabiaSenegalSerbiaSeychellesSierra LeoneSingaporeSint Maarten (Dutch part)Slovak RepublicSloveniaSmall statesSolomon IslandsSomaliaSouth AfricaSouth AsiaSouth Asia (IDA & IBRD)South SudanSpainSri LankaSt. Kitts and NevisSt. LuciaSt. Vincent and the GrenadinesSub-Saharan Africa Sub-Saharan Africa (excluding high income)Sub-Saharan Africa (IDA & IBRD countries)SudanSurinameSwazilandSwedenSwitzerlandSyrian Arab RepublicTajikistanTanzaniaThailandTimor-LesteTogoTongaTrinidad and TobagoTunisiaTurkeyTurkmenistanTurks and Caicos IslandsTuvaluUgandaUkraineUnited Arab EmiratesUnited KingdomUnited StatesUpper middle incomeUruguayUzbekistanVanuatuVenezuela, RBVietnamVirgin Islands (U.S.)West Bank and GazaWorldYemen, Rep.ZambiaZimbabwe Timeline:
This timeline shows a graph from 1961 to 2016 of Marshall Islands. No data until 1960. Number of actual observations by date: 56.
Source name:
World Development Indicators
Source organization:
World Bank Staff estimates based on United Nations, World Urbanization Prospects.
Categories, topics:
Agriculture & Rural Development
Last updated:
apr 23, 2017
Indicators value changes by year
Minimum:
27.316
jan 1, 2016
Maximum:
64.416
jan 1, 1961
At the date of observation
Value
Absolute change
Change from previous value
jan 1, 1961
64.416
+64.416
0.0%
jan 1, 1962
63.041
-1.375
-2.13%
jan 1, 1963
61.642
-1.399
-2.22%
jan 1, 1964
60.224
-1.418
-2.3%
jan 1, 1965
58.786
-1.438
-2.39%
jan 1, 1966
57.337
-1.449
-2.46%
jan 1, 1967
55.874
-1.463
-2.55%
jan 1, 1968
54.4
-1.474
-2.64%
jan 1, 1969
51.771
-2.629
-4.83%
jan 1, 1970
49.139
-2.632
-5.08%
jan 1, 1971
46.508
-2.631
-5.35%
jan 1, 1972
43.897
-2.611
-5.61%
jan 1, 1973
41.315
-2.582
-5.88%
jan 1, 1974
38.788
-2.527
-6.12%
jan 1, 1975
38.907
+0.119
0.31%
jan 1, 1976
39.368
+0.461
1.18%
jan 1, 1977
39.832
+0.464
1.18%
jan 1, 1978
40.296
+0.464
1.16%
jan 1, 1979
40.763
+0.467
1.16%
jan 1, 1980
41.231
+0.468
1.15%
jan 1, 1981
41.702
+0.471
1.14%
jan 1, 1982
41.174
-0.528
-1.27%
jan 1, 1983
40.386
-0.788
-1.91%
jan 1, 1984
39.604
-0.782
-1.94%
jan 1, 1985
38.825
-0.779
-1.97%
jan 1, 1986
38.055
-0.77
-1.98%
jan 1, 1987
37.289
-0.766
-2.01%
jan 1, 1988
36.53
-0.759
-2.04%
jan 1, 1989
35.776
-0.754
-2.06%
jan 1, 1990
35.286
-0.49
-1.37%
jan 1, 1991
34.946
-0.34
-0.96%
jan 1, 1992
34.608
-0.338
-0.97%
jan 1, 1993
34.272
-0.336
-0.97%
jan 1, 1994
33.937
-0.335
-0.98%
jan 1, 1995
33.604
-0.333
-0.98%
jan 1, 1996
33.273
-0.331
-0.99%
jan 1, 1997
32.942
-0.331
-0.99%
jan 1, 1998
32.615
-0.327
-0.99%
jan 1, 1999
32.288
-0.327
-1.0%
jan 1, 2000
31.963
-0.325
-1.01%
jan 1, 2001
31.642
-0.321
-1.0%
jan 1, 2002
31.326
-0.316
-1.0%
jan 1, 2003
31.013
-0.313
-1.0%
jan 1, 2004
30.704
-0.309
-1.0%
jan 1, 2005
30.4
-0.304
-0.99%
jan 1, 2006
30.099
-0.301
-0.99%
jan 1, 2007
29.803
-0.296
-0.98%
jan 1, 2008
29.51
-0.293
-0.98%
jan 1, 2009
29.222
-0.288
-0.98%
jan 1, 2010
28.938
-0.284
-0.97%
jan 1, 2011
28.657
-0.281
-0.97%
jan 1, 2012
28.381
-0.276
-0.96%
jan 1, 2013
28.109
-0.272
-0.96%
jan 1, 2014
27.841
-0.268
-0.95%
jan 1, 2015
27.576
-0.265
-0.95%
jan 1, 2016
27.316
-0.26
-0.94%
Ranking of countries by current statistics by years


Comments: