29
/
en
AIzaSyAYiBZKx7MnpbEhh9jyipgxe19OcubqV5w
April 1, 2024
229154
Romania
ROU
true
2
1
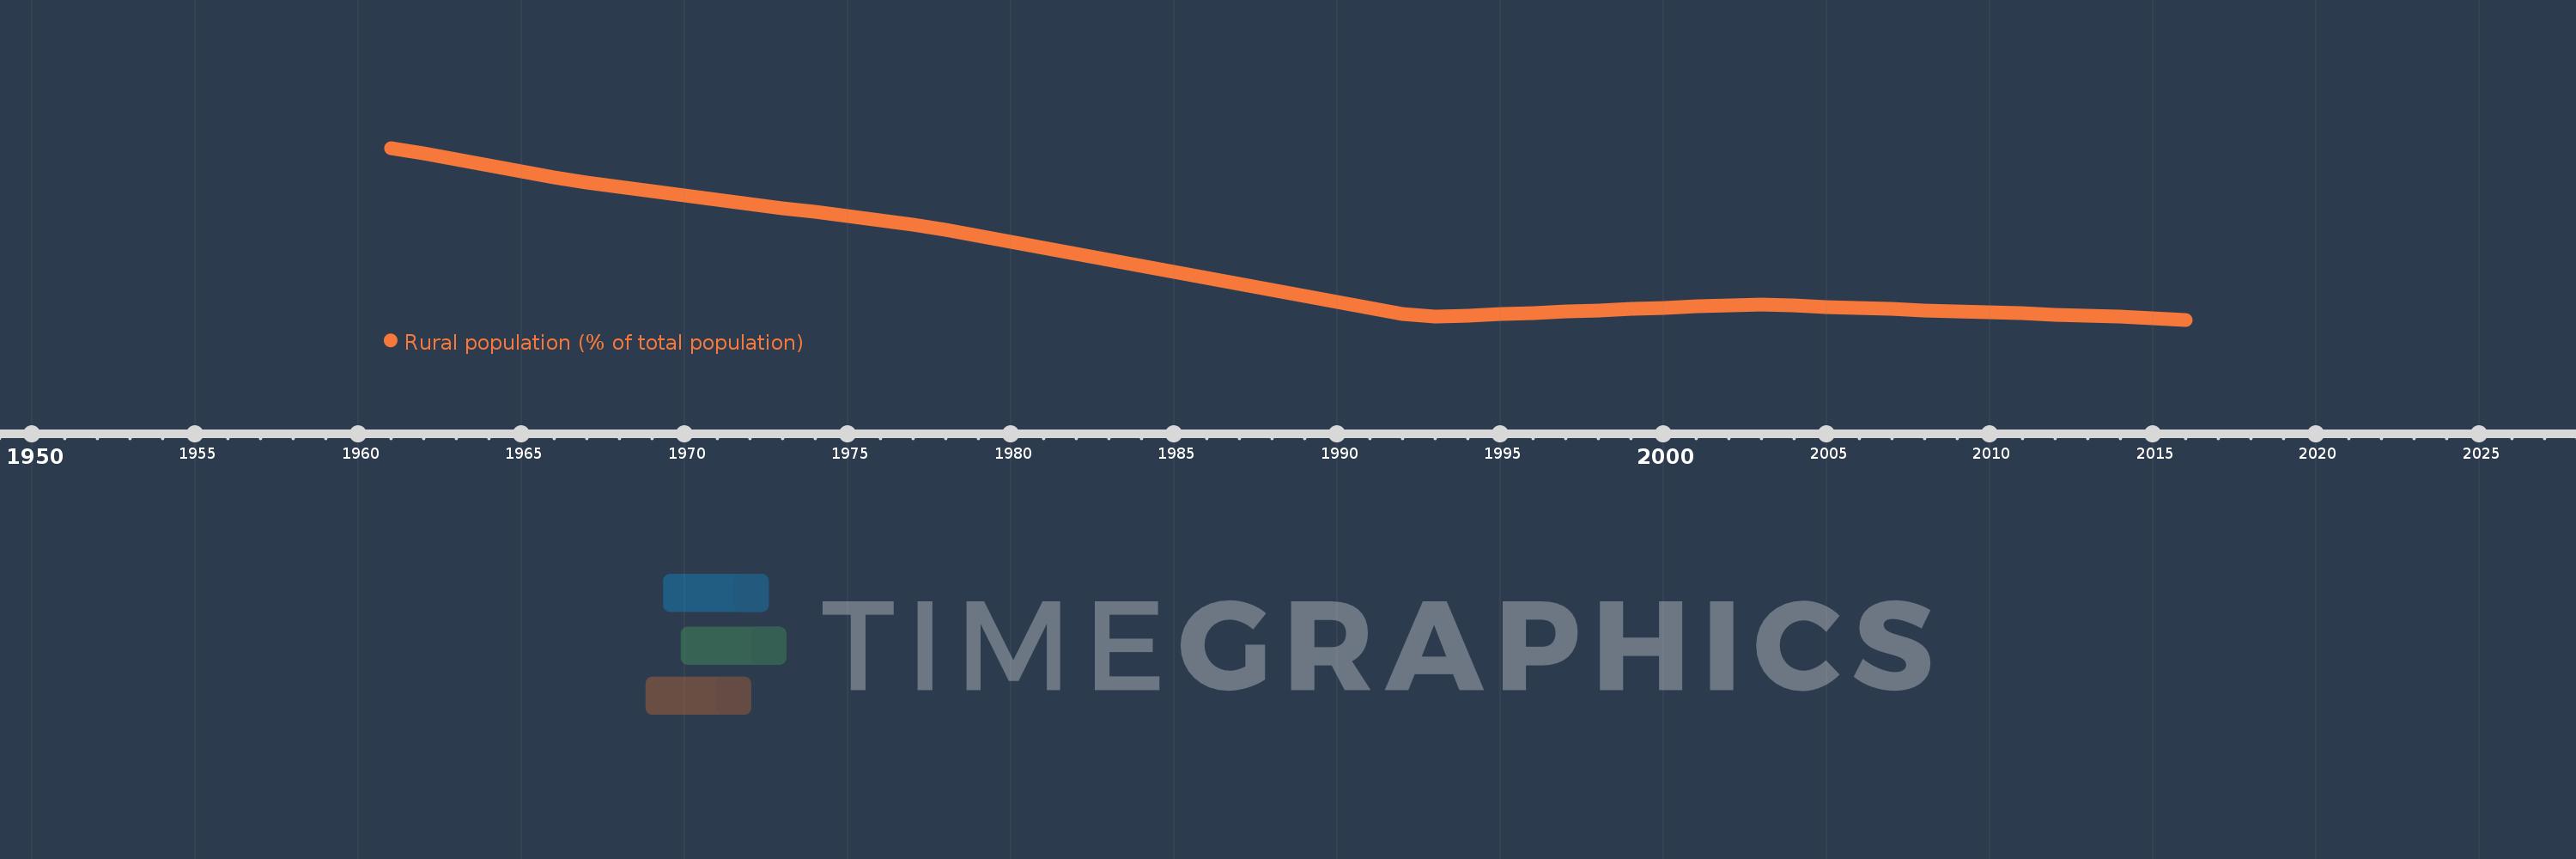
Rural population (% of total population)
2016,2015,2014,2013,2012,2011,2010,2009,2008,2007,2006,2005,2004,2003,2002,2001,2000,1999,1998,1997,1996,1995,1994,1993,1992,1991,1990,1989,1988,1987,1986,1985,1984,1983,1982,1981,1980,1979,1978,1977,1976,1975,1974,1973,1972,1971,1970,1969,1968,1967,1966,1965,1964,1963,1962,1961
This statistics in other country:
AfghanistanAlbaniaAlgeriaAmerican SamoaAndorraAngolaAntigua and BarbudaArab WorldArgentinaArmeniaArubaAustraliaAustriaAzerbaijanBahamas, TheBahrainBangladeshBarbadosBelarusBelgiumBelizeBeninBermudaBhutanBoliviaBosnia and HerzegovinaBotswanaBrazilBritish Virgin IslandsBrunei DarussalamBulgariaBurkina FasoBurundiCabo VerdeCambodiaCameroonCanadaCaribbean small statesCayman IslandsCentral African RepublicCentral Europe and the BalticsChadChannel IslandsChileChinaColombiaComorosCongo, Dem. Rep.Congo, Rep.Costa RicaCote d'IvoireCroatiaCubaCuracaoCyprusCzech RepublicDenmarkDjiboutiDominicaDominican RepublicEarly-demographic dividendEast Asia & PacificEast Asia & Pacific (excluding high income)East Asia & Pacific (IDA & IBRD countries)EcuadorEgypt, Arab Rep.El SalvadorEquatorial GuineaEritreaEstoniaEthiopiaEuro areaEurope & Central AsiaEurope & Central Asia (excluding high income)Europe & Central Asia (IDA & IBRD countries)European UnionFaroe IslandsFijiFinlandFragile and conflict affected situationsFranceFrench PolynesiaGabonGambia, TheGeorgiaGermanyGhanaGibraltarGreeceGreenlandGrenadaGuamGuatemalaGuineaGuinea-BissauGuyanaHaitiHeavily indebted poor countries (HIPC)High incomeHondurasHong Kong SAR, ChinaHungaryIBRD onlyIcelandIDA & IBRD totalIDA blendIDA onlyIDA totalIndiaIndonesiaIran, Islamic Rep.IraqIrelandIsle of ManIsraelItalyJamaicaJapanJordanKazakhstanKenyaKiribatiKorea, Dem. People’s Rep.Korea, Rep.KuwaitKyrgyz RepublicLao PDRLate-demographic dividendLatin America & Caribbean Latin America & Caribbean (excluding high income)Latin America & the Caribbean (IDA & IBRD countries)LatviaLeast developed countries: UN classificationLebanonLesothoLiberiaLibyaLiechtensteinLithuaniaLow & middle incomeLow incomeLower middle incomeLuxembourgMacao SAR, ChinaMacedonia, FYRMadagascarMalawiMalaysiaMaldivesMaliMaltaMarshall IslandsMauritaniaMauritiusMexicoMicronesia, Fed. Sts.Middle East & North AfricaMiddle East & North Africa (excluding high income)Middle East & North Africa (IDA & IBRD countries)Middle incomeMoldovaMonacoMongoliaMontenegroMoroccoMozambiqueMyanmarNamibiaNauruNepalNetherlandsNew CaledoniaNew ZealandNicaraguaNigerNigeriaNorth AmericaNorthern Mariana IslandsNorwayOECD membersOmanOther small statesPacific island small statesPakistanPalauPanamaPapua New GuineaParaguayPeruPhilippinesPolandPortugalPost-demographic dividendPre-demographic dividendPuerto RicoQatarRomaniaRussian FederationRwandaSamoaSan MarinoSao Tome and PrincipeSaudi ArabiaSenegalSerbiaSeychellesSierra LeoneSingaporeSint Maarten (Dutch part)Slovak RepublicSloveniaSmall statesSolomon IslandsSomaliaSouth AfricaSouth AsiaSouth Asia (IDA & IBRD)South SudanSpainSri LankaSt. Kitts and NevisSt. LuciaSt. Vincent and the GrenadinesSub-Saharan Africa Sub-Saharan Africa (excluding high income)Sub-Saharan Africa (IDA & IBRD countries)SudanSurinameSwazilandSwedenSwitzerlandSyrian Arab RepublicTajikistanTanzaniaThailandTimor-LesteTogoTongaTrinidad and TobagoTunisiaTurkeyTurkmenistanTurks and Caicos IslandsTuvaluUgandaUkraineUnited Arab EmiratesUnited KingdomUnited StatesUpper middle incomeUruguayUzbekistanVanuatuVenezuela, RBVietnamVirgin Islands (U.S.)West Bank and GazaWorldYemen, Rep.ZambiaZimbabwe Timeline:
This timeline shows a graph from 1961 to 2016 of Romania. No data until 1960. Number of actual observations by date: 56.
Source name:
World Development Indicators
Source organization:
World Bank Staff estimates based on United Nations, World Urbanization Prospects.
Categories, topics:
Agriculture & Rural Development
Last updated:
apr 23, 2017
Indicators value changes by year
Minimum:
45.436
jan 1, 2016
Maximum:
65.791
jan 1, 1961
At the date of observation
Value
Absolute change
Change from previous value
jan 1, 1961
65.791
+65.791
0.0%
jan 1, 1962
65.106
-0.685
-1.04%
jan 1, 1963
64.414
-0.692
-1.06%
jan 1, 1964
63.716
-0.698
-1.08%
jan 1, 1965
63.011
-0.705
-1.11%
jan 1, 1966
62.303
-0.708
-1.12%
jan 1, 1967
61.655
-0.648
-1.04%
jan 1, 1968
61.165
-0.49
-0.79%
jan 1, 1969
60.672
-0.493
-0.81%
jan 1, 1970
60.178
-0.494
-0.81%
jan 1, 1971
59.681
-0.497
-0.83%
jan 1, 1972
59.182
-0.499
-0.84%
jan 1, 1973
58.681
-0.501
-0.85%
jan 1, 1974
58.179
-0.502
-0.86%
jan 1, 1975
57.675
-0.504
-0.87%
jan 1, 1976
57.169
-0.506
-0.88%
jan 1, 1977
56.661
-0.508
-0.89%
jan 1, 1978
56.058
-0.603
-1.06%
jan 1, 1979
55.351
-0.707
-1.26%
jan 1, 1980
54.642
-0.709
-1.28%
jan 1, 1981
53.93
-0.712
-1.3%
jan 1, 1982
53.219
-0.711
-1.32%
jan 1, 1983
52.505
-0.714
-1.34%
jan 1, 1984
51.79
-0.715
-1.36%
jan 1, 1985
51.074
-0.716
-1.38%
jan 1, 1986
50.359
-0.715
-1.4%
jan 1, 1987
49.643
-0.716
-1.42%
jan 1, 1988
48.927
-0.716
-1.44%
jan 1, 1989
48.21
-0.717
-1.47%
jan 1, 1990
47.496
-0.714
-1.48%
jan 1, 1991
46.783
-0.713
-1.5%
jan 1, 1992
46.07
-0.713
-1.52%
jan 1, 1993
45.773
-0.297
-0.64%
jan 1, 1994
45.926
+0.153
0.33%
jan 1, 1995
46.078
+0.152
0.33%
jan 1, 1996
46.231
+0.153
0.33%
jan 1, 1997
46.384
+0.153
0.33%
jan 1, 1998
46.537
+0.153
0.33%
jan 1, 1999
46.689
+0.152
0.33%
jan 1, 2000
46.842
+0.153
0.33%
jan 1, 2001
46.996
+0.154
0.33%
jan 1, 2002
47.148
+0.152
0.32%
jan 1, 2003
47.22
+0.072
0.15%
jan 1, 2004
47.088
-0.132
-0.28%
jan 1, 2005
46.957
-0.131
-0.28%
jan 1, 2006
46.826
-0.131
-0.28%
jan 1, 2007
46.695
-0.131
-0.28%
jan 1, 2008
46.564
-0.131
-0.28%
jan 1, 2009
46.433
-0.131
-0.28%
jan 1, 2010
46.302
-0.131
-0.28%
jan 1, 2011
46.171
-0.131
-0.28%
jan 1, 2012
46.04
-0.131
-0.28%
jan 1, 2013
45.909
-0.131
-0.28%
jan 1, 2014
45.765
-0.144
-0.31%
jan 1, 2015
45.607
-0.158
-0.35%
jan 1, 2016
45.436
-0.171
-0.37%
Ranking of countries by current statistics by years


Comments: