29
/
en
AIzaSyAYiBZKx7MnpbEhh9jyipgxe19OcubqV5w
April 1, 2024
99252
Cambodia
KHM
true
2
1
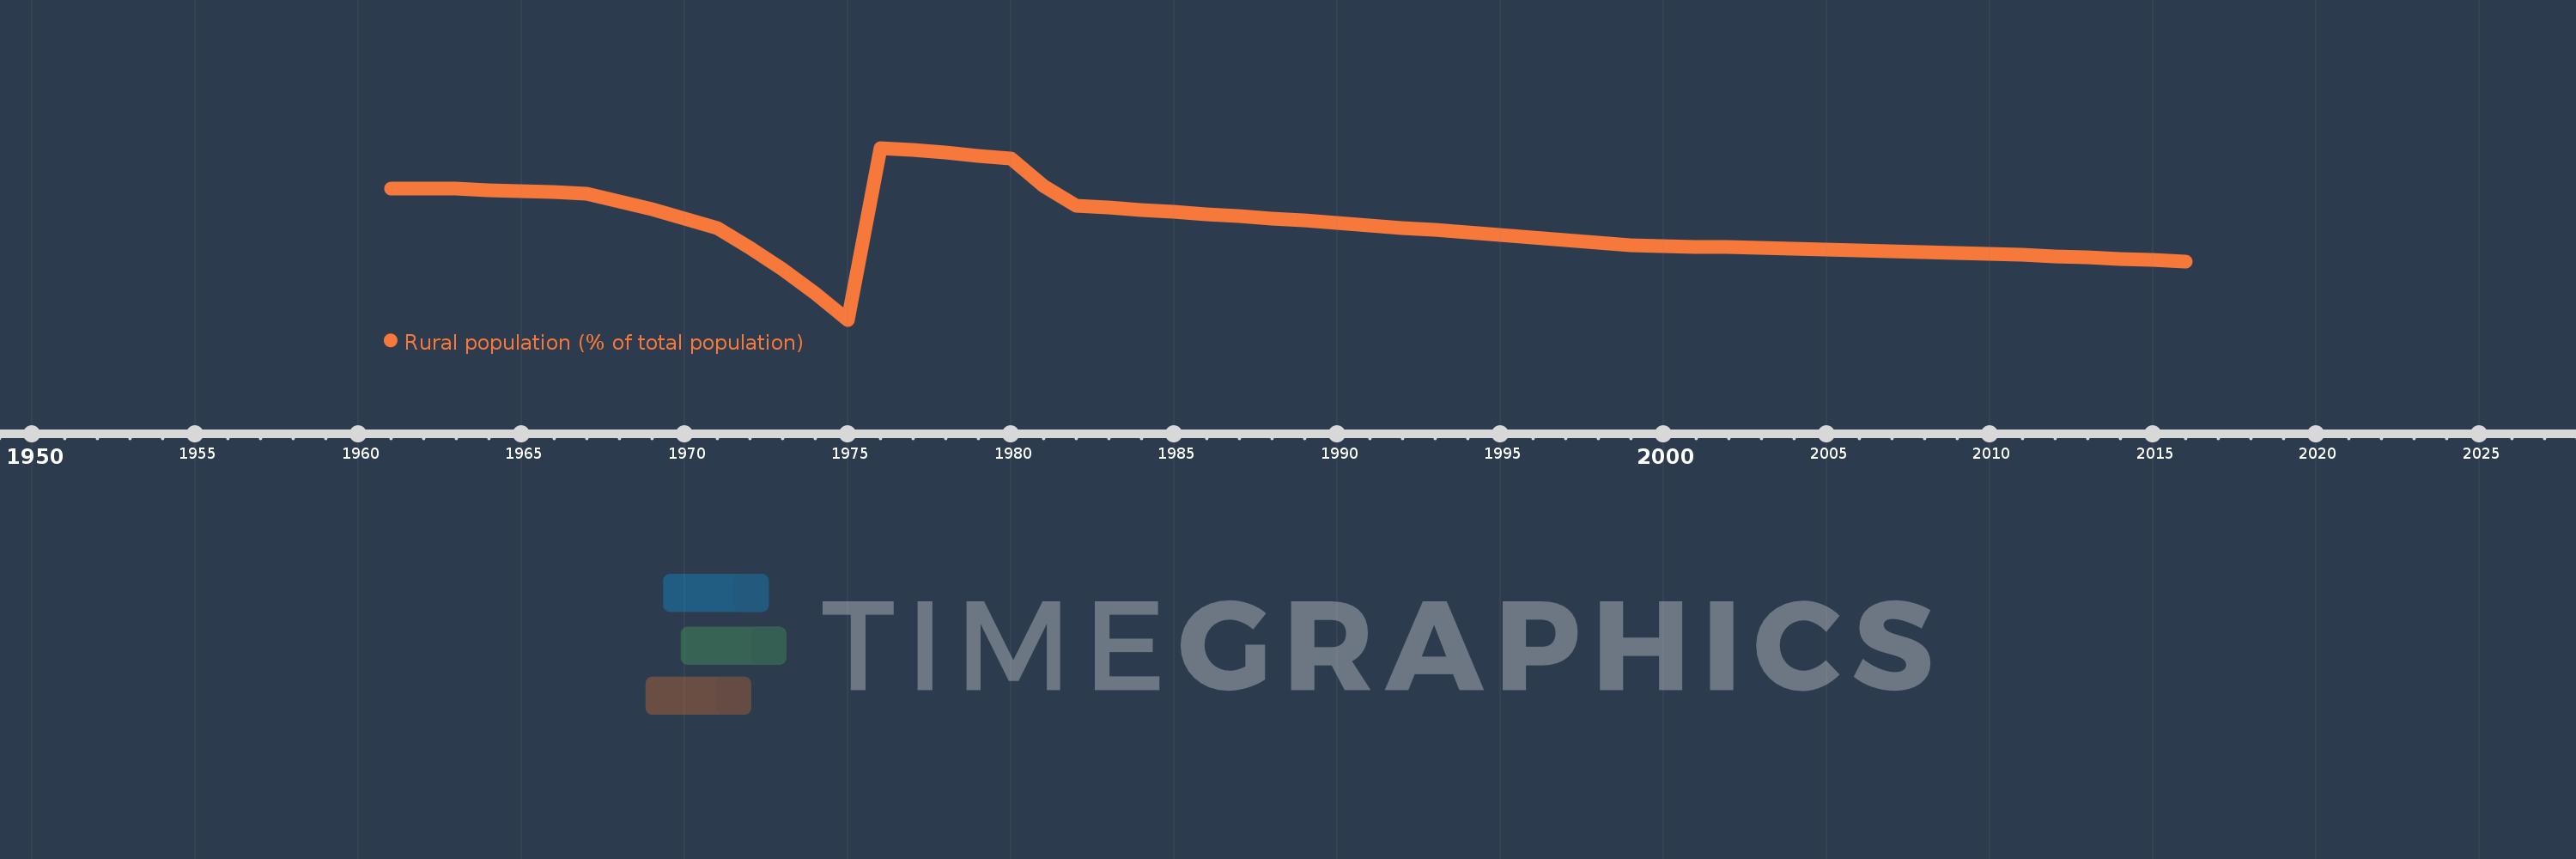
Rural population (% of total population)
2016,2015,2014,2013,2012,2011,2010,2009,2008,2007,2006,2005,2004,2003,2002,2001,2000,1999,1998,1997,1996,1995,1994,1993,1992,1991,1990,1989,1988,1987,1986,1985,1984,1983,1982,1981,1980,1979,1978,1977,1976,1975,1974,1973,1972,1971,1970,1969,1968,1967,1966,1965,1964,1963,1962,1961
This statistics in other country:
AfghanistanAlbaniaAlgeriaAmerican SamoaAndorraAngolaAntigua and BarbudaArab WorldArgentinaArmeniaArubaAustraliaAustriaAzerbaijanBahamas, TheBahrainBangladeshBarbadosBelarusBelgiumBelizeBeninBermudaBhutanBoliviaBosnia and HerzegovinaBotswanaBrazilBritish Virgin IslandsBrunei DarussalamBulgariaBurkina FasoBurundiCabo VerdeCambodiaCameroonCanadaCaribbean small statesCayman IslandsCentral African RepublicCentral Europe and the BalticsChadChannel IslandsChileChinaColombiaComorosCongo, Dem. Rep.Congo, Rep.Costa RicaCote d'IvoireCroatiaCubaCuracaoCyprusCzech RepublicDenmarkDjiboutiDominicaDominican RepublicEarly-demographic dividendEast Asia & PacificEast Asia & Pacific (excluding high income)East Asia & Pacific (IDA & IBRD countries)EcuadorEgypt, Arab Rep.El SalvadorEquatorial GuineaEritreaEstoniaEthiopiaEuro areaEurope & Central AsiaEurope & Central Asia (excluding high income)Europe & Central Asia (IDA & IBRD countries)European UnionFaroe IslandsFijiFinlandFragile and conflict affected situationsFranceFrench PolynesiaGabonGambia, TheGeorgiaGermanyGhanaGibraltarGreeceGreenlandGrenadaGuamGuatemalaGuineaGuinea-BissauGuyanaHaitiHeavily indebted poor countries (HIPC)High incomeHondurasHong Kong SAR, ChinaHungaryIBRD onlyIcelandIDA & IBRD totalIDA blendIDA onlyIDA totalIndiaIndonesiaIran, Islamic Rep.IraqIrelandIsle of ManIsraelItalyJamaicaJapanJordanKazakhstanKenyaKiribatiKorea, Dem. People’s Rep.Korea, Rep.KuwaitKyrgyz RepublicLao PDRLate-demographic dividendLatin America & Caribbean Latin America & Caribbean (excluding high income)Latin America & the Caribbean (IDA & IBRD countries)LatviaLeast developed countries: UN classificationLebanonLesothoLiberiaLibyaLiechtensteinLithuaniaLow & middle incomeLow incomeLower middle incomeLuxembourgMacao SAR, ChinaMacedonia, FYRMadagascarMalawiMalaysiaMaldivesMaliMaltaMarshall IslandsMauritaniaMauritiusMexicoMicronesia, Fed. Sts.Middle East & North AfricaMiddle East & North Africa (excluding high income)Middle East & North Africa (IDA & IBRD countries)Middle incomeMoldovaMonacoMongoliaMontenegroMoroccoMozambiqueMyanmarNamibiaNauruNepalNetherlandsNew CaledoniaNew ZealandNicaraguaNigerNigeriaNorth AmericaNorthern Mariana IslandsNorwayOECD membersOmanOther small statesPacific island small statesPakistanPalauPanamaPapua New GuineaParaguayPeruPhilippinesPolandPortugalPost-demographic dividendPre-demographic dividendPuerto RicoQatarRomaniaRussian FederationRwandaSamoaSan MarinoSao Tome and PrincipeSaudi ArabiaSenegalSerbiaSeychellesSierra LeoneSingaporeSint Maarten (Dutch part)Slovak RepublicSloveniaSmall statesSolomon IslandsSomaliaSouth AfricaSouth AsiaSouth Asia (IDA & IBRD)South SudanSpainSri LankaSt. Kitts and NevisSt. LuciaSt. Vincent and the GrenadinesSub-Saharan Africa Sub-Saharan Africa (excluding high income)Sub-Saharan Africa (IDA & IBRD countries)SudanSurinameSwazilandSwedenSwitzerlandSyrian Arab RepublicTajikistanTanzaniaThailandTimor-LesteTogoTongaTrinidad and TobagoTunisiaTurkeyTurkmenistanTurks and Caicos IslandsTuvaluUgandaUkraineUnited Arab EmiratesUnited KingdomUnited StatesUpper middle incomeUruguayUzbekistanVanuatuVenezuela, RBVietnamVirgin Islands (U.S.)West Bank and GazaWorldYemen, Rep.ZambiaZimbabwe Timeline:
This timeline shows a graph from 1961 to 2016 of Cambodia. No data until 1960. Number of actual observations by date: 56.
Source name:
World Development Indicators
Source organization:
World Bank Staff estimates based on United Nations, World Urbanization Prospects.
Categories, topics:
Agriculture & Rural Development
Last updated:
apr 23, 2017
Indicators value changes by year
Minimum:
70.945
jan 1, 1975
Maximum:
95.523
jan 1, 1976
At the date of observation
Value
Absolute change
Change from previous value
jan 1, 1961
89.715
+89.715
0.0%
jan 1, 1962
89.707
-0.008
-0.01%
jan 1, 1963
89.667
-0.04
-0.04%
jan 1, 1964
89.503
-0.164
-0.18%
jan 1, 1965
89.338
-0.165
-0.18%
jan 1, 1966
89.17
-0.168
-0.19%
jan 1, 1967
89.0
-0.17
-0.19%
jan 1, 1968
87.902
-1.098
-1.23%
jan 1, 1969
86.709
-1.193
-1.36%
jan 1, 1970
85.421
-1.288
-1.49%
jan 1, 1971
84.03
-1.391
-1.63%
jan 1, 1972
81.283
-2.747
-3.27%
jan 1, 1973
78.182
-3.101
-3.82%
jan 1, 1974
74.737
-3.445
-4.41%
jan 1, 1975
70.945
-3.792
-5.07%
jan 1, 1976
95.523
+24.578
34.64%
jan 1, 1977
95.18
-0.343
-0.36%
jan 1, 1978
94.814
-0.366
-0.38%
jan 1, 1979
94.422
-0.392
-0.41%
jan 1, 1980
94.001
-0.421
-0.45%
jan 1, 1981
90.102
-3.899
-4.15%
jan 1, 1982
87.258
-2.844
-3.16%
jan 1, 1983
86.969
-0.289
-0.33%
jan 1, 1984
86.675
-0.294
-0.34%
jan 1, 1985
86.374
-0.301
-0.35%
jan 1, 1986
86.069
-0.305
-0.35%
jan 1, 1987
85.758
-0.311
-0.36%
jan 1, 1988
85.441
-0.317
-0.37%
jan 1, 1989
85.117
-0.324
-0.38%
jan 1, 1990
84.789
-0.328
-0.39%
jan 1, 1991
84.454
-0.335
-0.4%
jan 1, 1992
84.113
-0.341
-0.4%
jan 1, 1993
83.766
-0.347
-0.41%
jan 1, 1994
83.413
-0.353
-0.42%
jan 1, 1995
83.054
-0.359
-0.43%
jan 1, 1996
82.689
-0.365
-0.44%
jan 1, 1997
82.317
-0.372
-0.45%
jan 1, 1998
81.94
-0.377
-0.46%
jan 1, 1999
81.645
-0.295
-0.36%
jan 1, 2000
81.53
-0.115
-0.14%
jan 1, 2001
81.414
-0.116
-0.14%
jan 1, 2002
81.297
-0.117
-0.14%
jan 1, 2003
81.18
-0.117
-0.14%
jan 1, 2004
81.063
-0.117
-0.14%
jan 1, 2005
80.945
-0.118
-0.15%
jan 1, 2006
80.826
-0.119
-0.15%
jan 1, 2007
80.707
-0.119
-0.15%
jan 1, 2008
80.587
-0.12
-0.15%
jan 1, 2009
80.467
-0.12
-0.15%
jan 1, 2010
80.334
-0.133
-0.17%
jan 1, 2011
80.19
-0.144
-0.18%
jan 1, 2012
80.033
-0.157
-0.2%
jan 1, 2013
79.863
-0.17
-0.21%
jan 1, 2014
79.681
-0.182
-0.23%
jan 1, 2015
79.486
-0.195
-0.24%
jan 1, 2016
79.277
-0.209
-0.26%
Ranking of countries by current statistics by years


Comments: