29
/
en
AIzaSyAYiBZKx7MnpbEhh9jyipgxe19OcubqV5w
April 1, 2024
286560
Zambia
ZMB
true
2
1
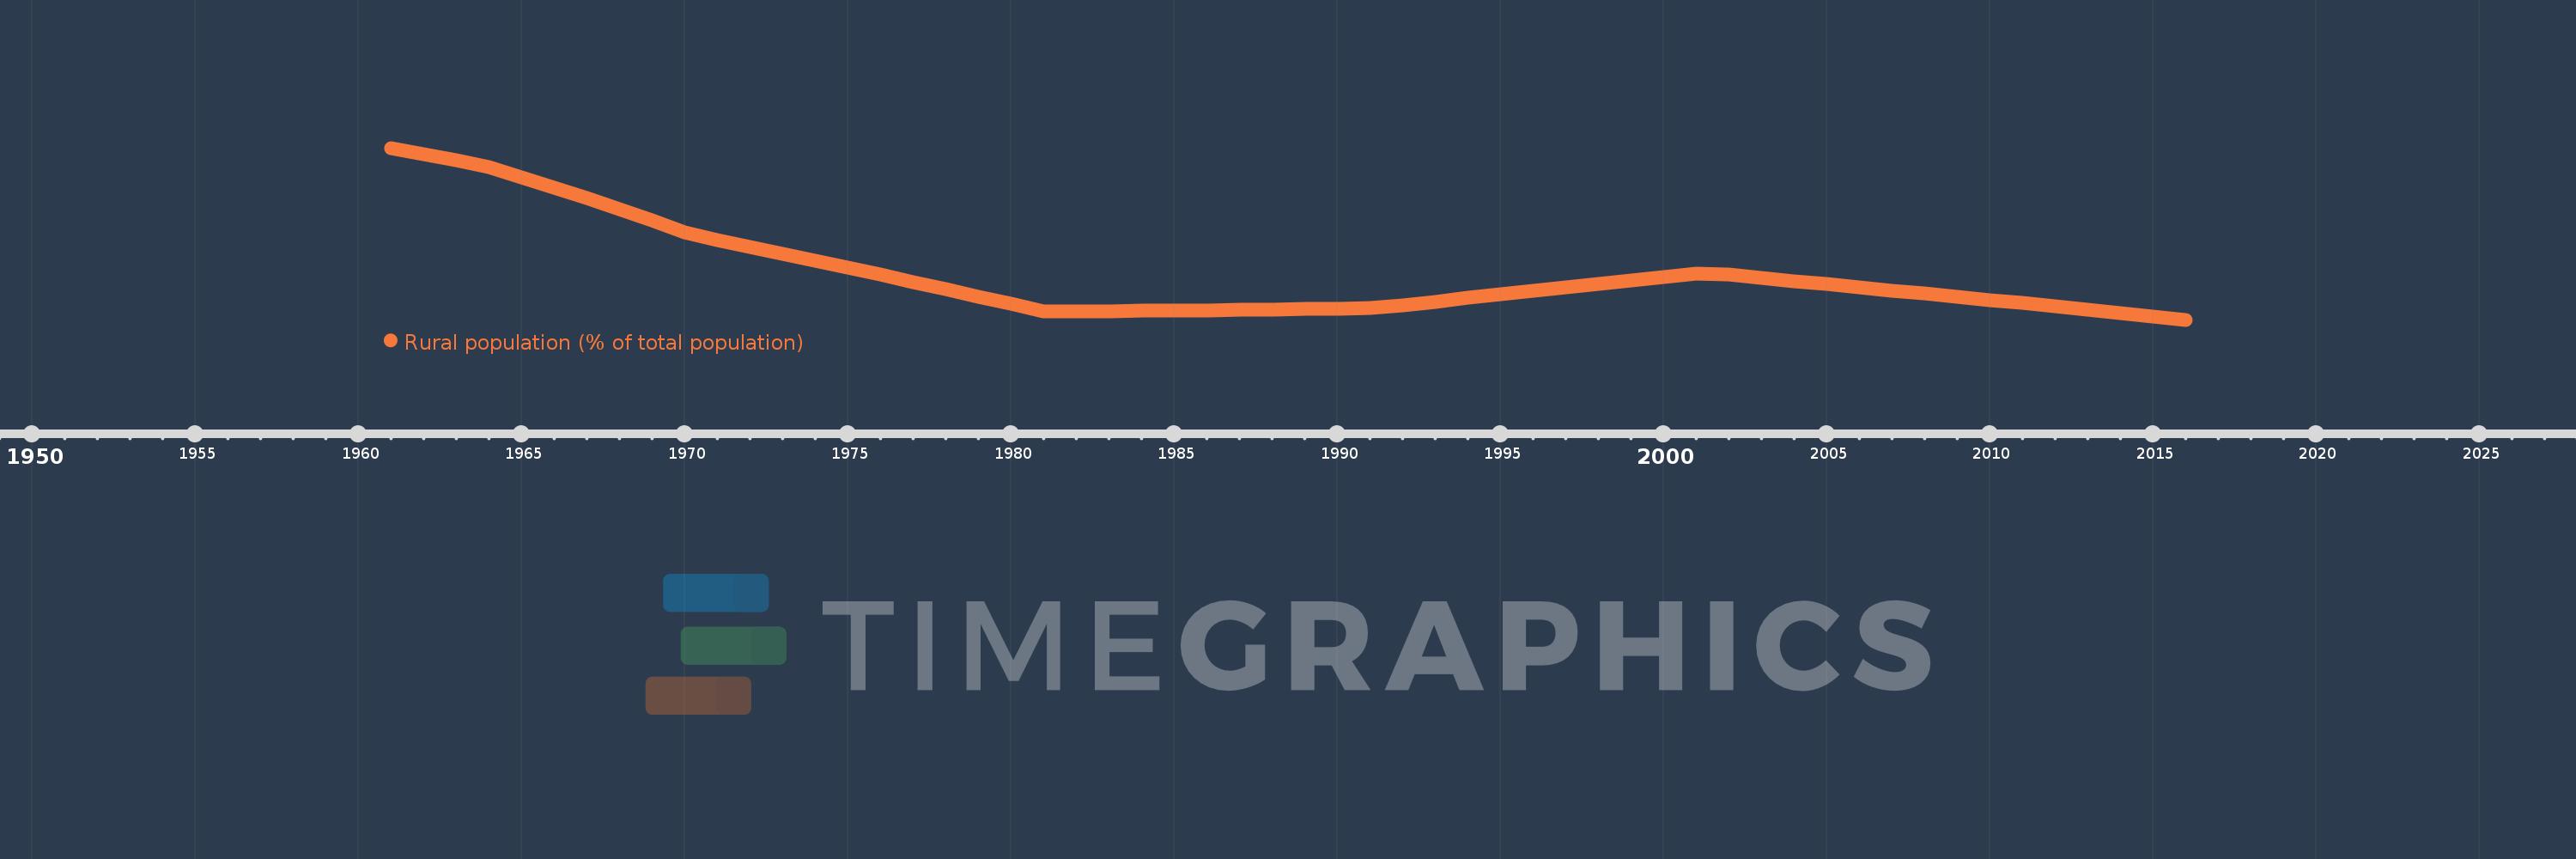
Rural population (% of total population)
2016,2015,2014,2013,2012,2011,2010,2009,2008,2007,2006,2005,2004,2003,2002,2001,2000,1999,1998,1997,1996,1995,1994,1993,1992,1991,1990,1989,1988,1987,1986,1985,1984,1983,1982,1981,1980,1979,1978,1977,1976,1975,1974,1973,1972,1971,1970,1969,1968,1967,1966,1965,1964,1963,1962,1961
This statistics in other country:
AfghanistanAlbaniaAlgeriaAmerican SamoaAndorraAngolaAntigua and BarbudaArab WorldArgentinaArmeniaArubaAustraliaAustriaAzerbaijanBahamas, TheBahrainBangladeshBarbadosBelarusBelgiumBelizeBeninBermudaBhutanBoliviaBosnia and HerzegovinaBotswanaBrazilBritish Virgin IslandsBrunei DarussalamBulgariaBurkina FasoBurundiCabo VerdeCambodiaCameroonCanadaCaribbean small statesCayman IslandsCentral African RepublicCentral Europe and the BalticsChadChannel IslandsChileChinaColombiaComorosCongo, Dem. Rep.Congo, Rep.Costa RicaCote d'IvoireCroatiaCubaCuracaoCyprusCzech RepublicDenmarkDjiboutiDominicaDominican RepublicEarly-demographic dividendEast Asia & PacificEast Asia & Pacific (excluding high income)East Asia & Pacific (IDA & IBRD countries)EcuadorEgypt, Arab Rep.El SalvadorEquatorial GuineaEritreaEstoniaEthiopiaEuro areaEurope & Central AsiaEurope & Central Asia (excluding high income)Europe & Central Asia (IDA & IBRD countries)European UnionFaroe IslandsFijiFinlandFragile and conflict affected situationsFranceFrench PolynesiaGabonGambia, TheGeorgiaGermanyGhanaGibraltarGreeceGreenlandGrenadaGuamGuatemalaGuineaGuinea-BissauGuyanaHaitiHeavily indebted poor countries (HIPC)High incomeHondurasHong Kong SAR, ChinaHungaryIBRD onlyIcelandIDA & IBRD totalIDA blendIDA onlyIDA totalIndiaIndonesiaIran, Islamic Rep.IraqIrelandIsle of ManIsraelItalyJamaicaJapanJordanKazakhstanKenyaKiribatiKorea, Dem. People’s Rep.Korea, Rep.KuwaitKyrgyz RepublicLao PDRLate-demographic dividendLatin America & Caribbean Latin America & Caribbean (excluding high income)Latin America & the Caribbean (IDA & IBRD countries)LatviaLeast developed countries: UN classificationLebanonLesothoLiberiaLibyaLiechtensteinLithuaniaLow & middle incomeLow incomeLower middle incomeLuxembourgMacao SAR, ChinaMacedonia, FYRMadagascarMalawiMalaysiaMaldivesMaliMaltaMarshall IslandsMauritaniaMauritiusMexicoMicronesia, Fed. Sts.Middle East & North AfricaMiddle East & North Africa (excluding high income)Middle East & North Africa (IDA & IBRD countries)Middle incomeMoldovaMonacoMongoliaMontenegroMoroccoMozambiqueMyanmarNamibiaNauruNepalNetherlandsNew CaledoniaNew ZealandNicaraguaNigerNigeriaNorth AmericaNorthern Mariana IslandsNorwayOECD membersOmanOther small statesPacific island small statesPakistanPalauPanamaPapua New GuineaParaguayPeruPhilippinesPolandPortugalPost-demographic dividendPre-demographic dividendPuerto RicoQatarRomaniaRussian FederationRwandaSamoaSan MarinoSao Tome and PrincipeSaudi ArabiaSenegalSerbiaSeychellesSierra LeoneSingaporeSint Maarten (Dutch part)Slovak RepublicSloveniaSmall statesSolomon IslandsSomaliaSouth AfricaSouth AsiaSouth Asia (IDA & IBRD)South SudanSpainSri LankaSt. Kitts and NevisSt. LuciaSt. Vincent and the GrenadinesSub-Saharan Africa Sub-Saharan Africa (excluding high income)Sub-Saharan Africa (IDA & IBRD countries)SudanSurinameSwazilandSwedenSwitzerlandSyrian Arab RepublicTajikistanTanzaniaThailandTimor-LesteTogoTongaTrinidad and TobagoTunisiaTurkeyTurkmenistanTurks and Caicos IslandsTuvaluUgandaUkraineUnited Arab EmiratesUnited KingdomUnited StatesUpper middle incomeUruguayUzbekistanVanuatuVenezuela, RBVietnamVirgin Islands (U.S.)West Bank and GazaWorldYemen, Rep.ZambiaZimbabwe Timeline:
This timeline shows a graph from 1961 to 2016 of Zambia. No data until 1960. Number of actual observations by date: 56.
Source name:
World Development Indicators
Source organization:
World Bank Staff estimates based on United Nations, World Urbanization Prospects.
Categories, topics:
Agriculture & Rural Development
Last updated:
apr 23, 2017
Indicators value changes by year
Minimum:
59.078
jan 1, 2016
Maximum:
81.855
jan 1, 1961
At the date of observation
Value
Absolute change
Change from previous value
jan 1, 1961
81.855
+81.855
0.0%
jan 1, 1962
81.049
-0.806
-0.98%
jan 1, 1963
80.215
-0.834
-1.03%
jan 1, 1964
79.288
-0.927
-1.16%
jan 1, 1965
77.985
-1.303
-1.64%
jan 1, 1966
76.628
-1.357
-1.74%
jan 1, 1967
75.211
-1.417
-1.85%
jan 1, 1968
73.739
-1.472
-1.96%
jan 1, 1969
72.209
-1.53
-2.07%
jan 1, 1970
70.63
-1.579
-2.19%
jan 1, 1971
69.649
-0.981
-1.39%
jan 1, 1972
68.759
-0.89
-1.28%
jan 1, 1973
67.854
-0.905
-1.32%
jan 1, 1974
66.939
-0.915
-1.35%
jan 1, 1975
66.008
-0.931
-1.39%
jan 1, 1976
65.066
-0.942
-1.43%
jan 1, 1977
64.11
-0.956
-1.47%
jan 1, 1978
63.145
-0.965
-1.51%
jan 1, 1979
62.168
-0.977
-1.55%
jan 1, 1980
61.182
-0.986
-1.59%
jan 1, 1981
60.185
-0.997
-1.63%
jan 1, 1982
60.146
-0.039
-0.06%
jan 1, 1983
60.195
+0.049
0.08%
jan 1, 1984
60.245
+0.05
0.08%
jan 1, 1985
60.295
+0.05
0.08%
jan 1, 1986
60.345
+0.05
0.08%
jan 1, 1987
60.394
+0.049
0.08%
jan 1, 1988
60.444
+0.05
0.08%
jan 1, 1989
60.494
+0.05
0.08%
jan 1, 1990
60.544
+0.05
0.08%
jan 1, 1991
60.593
+0.049
0.08%
jan 1, 1992
61.011
+0.418
0.69%
jan 1, 1993
61.486
+0.475
0.78%
jan 1, 1994
61.958
+0.472
0.77%
jan 1, 1995
62.428
+0.47
0.76%
jan 1, 1996
62.896
+0.468
0.75%
jan 1, 1997
63.362
+0.466
0.74%
jan 1, 1998
63.824
+0.462
0.73%
jan 1, 1999
64.284
+0.46
0.72%
jan 1, 2000
64.742
+0.458
0.71%
jan 1, 2001
65.198
+0.456
0.7%
jan 1, 2002
65.042
-0.156
-0.24%
jan 1, 2003
64.631
-0.411
-0.63%
jan 1, 2004
64.219
-0.412
-0.64%
jan 1, 2005
63.804
-0.415
-0.65%
jan 1, 2006
63.388
-0.416
-0.65%
jan 1, 2007
62.969
-0.419
-0.66%
jan 1, 2008
62.548
-0.421
-0.67%
jan 1, 2009
62.125
-0.423
-0.68%
jan 1, 2010
61.701
-0.424
-0.68%
jan 1, 2011
61.275
-0.426
-0.69%
jan 1, 2012
60.847
-0.428
-0.7%
jan 1, 2013
60.413
-0.434
-0.71%
jan 1, 2014
59.973
-0.44
-0.73%
jan 1, 2015
59.528
-0.445
-0.74%
jan 1, 2016
59.078
-0.45
-0.76%
Ranking of countries by current statistics by years


Comments: