29
/
en
AIzaSyAYiBZKx7MnpbEhh9jyipgxe19OcubqV5w
April 1, 2024
202261
Morocco
MAR
true
2
1
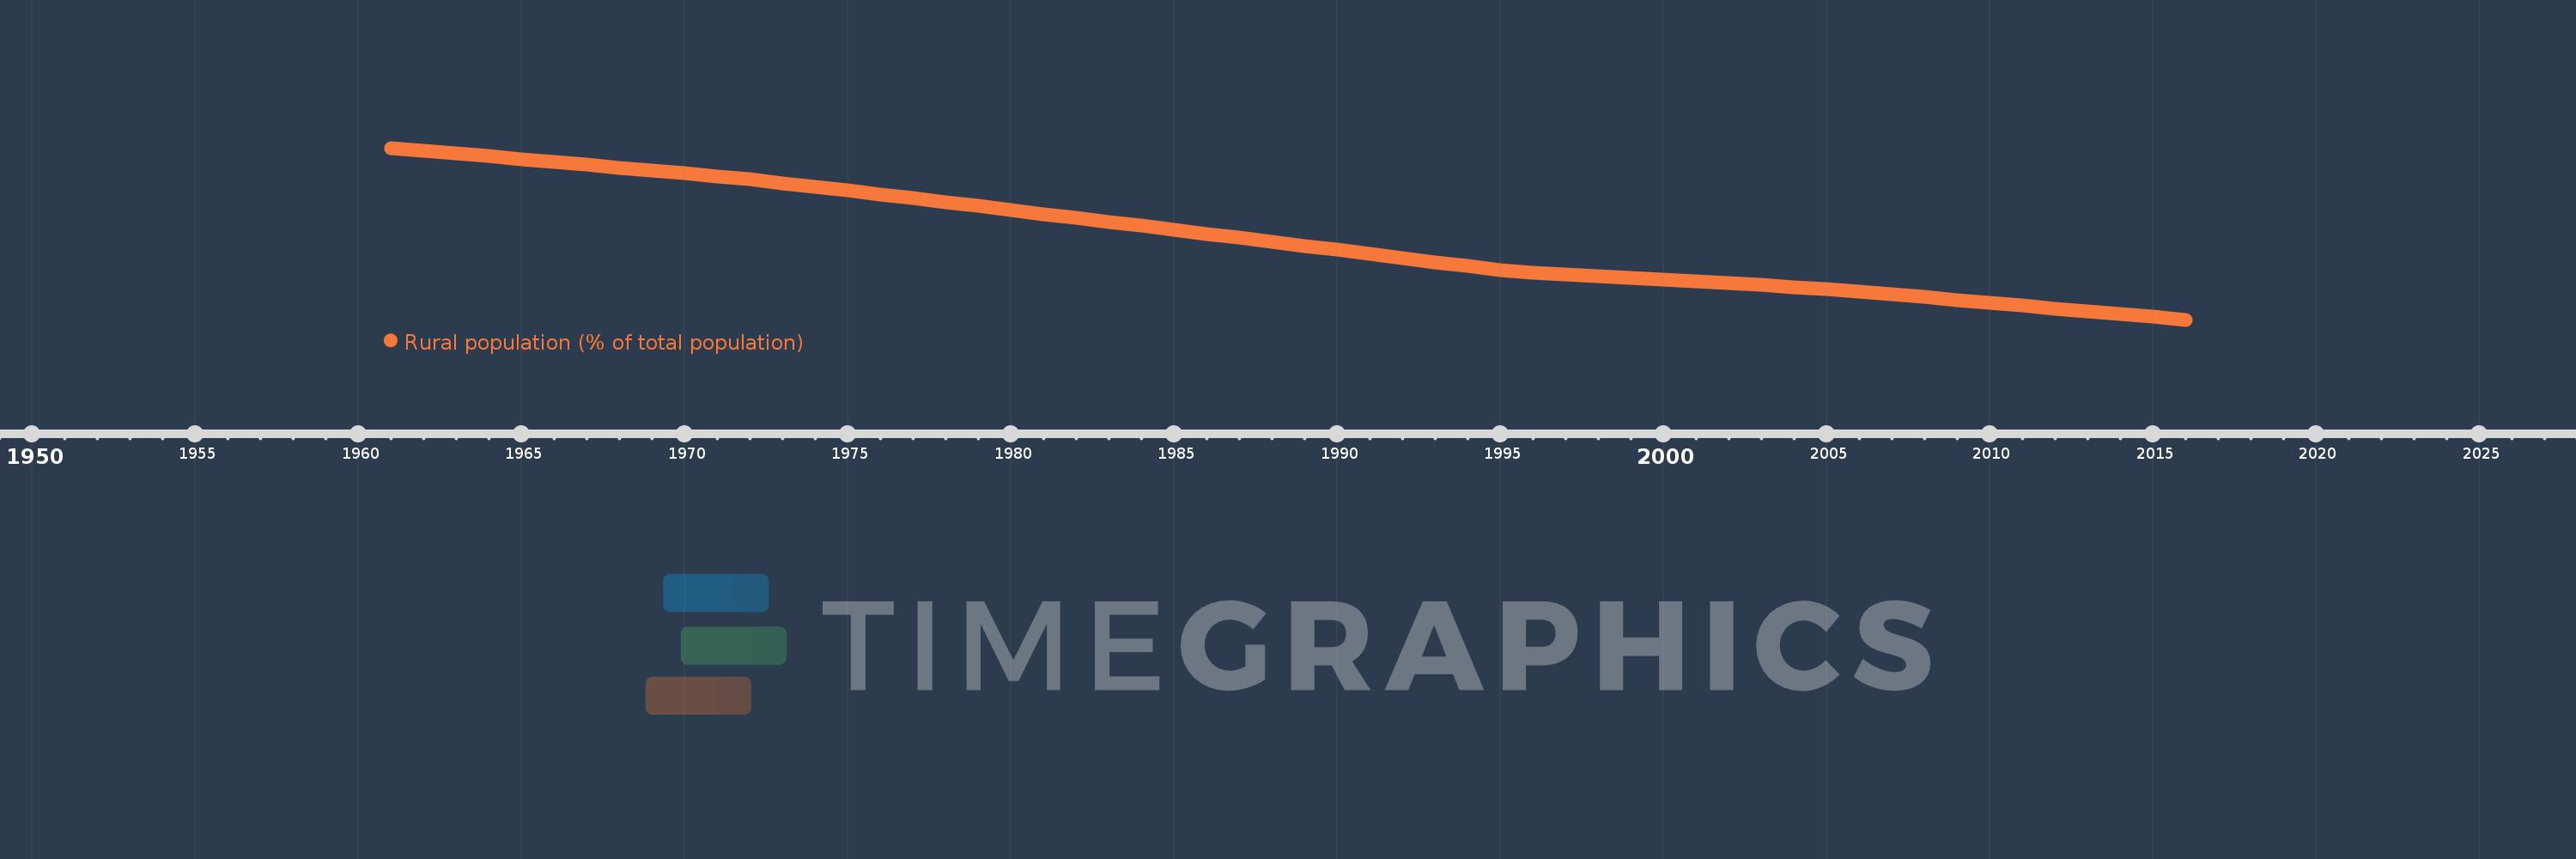
Rural population (% of total population)
2016,2015,2014,2013,2012,2011,2010,2009,2008,2007,2006,2005,2004,2003,2002,2001,2000,1999,1998,1997,1996,1995,1994,1993,1992,1991,1990,1989,1988,1987,1986,1985,1984,1983,1982,1981,1980,1979,1978,1977,1976,1975,1974,1973,1972,1971,1970,1969,1968,1967,1966,1965,1964,1963,1962,1961
This statistics in other country:
AfghanistanAlbaniaAlgeriaAmerican SamoaAndorraAngolaAntigua and BarbudaArab WorldArgentinaArmeniaArubaAustraliaAustriaAzerbaijanBahamas, TheBahrainBangladeshBarbadosBelarusBelgiumBelizeBeninBermudaBhutanBoliviaBosnia and HerzegovinaBotswanaBrazilBritish Virgin IslandsBrunei DarussalamBulgariaBurkina FasoBurundiCabo VerdeCambodiaCameroonCanadaCaribbean small statesCayman IslandsCentral African RepublicCentral Europe and the BalticsChadChannel IslandsChileChinaColombiaComorosCongo, Dem. Rep.Congo, Rep.Costa RicaCote d'IvoireCroatiaCubaCuracaoCyprusCzech RepublicDenmarkDjiboutiDominicaDominican RepublicEarly-demographic dividendEast Asia & PacificEast Asia & Pacific (excluding high income)East Asia & Pacific (IDA & IBRD countries)EcuadorEgypt, Arab Rep.El SalvadorEquatorial GuineaEritreaEstoniaEthiopiaEuro areaEurope & Central AsiaEurope & Central Asia (excluding high income)Europe & Central Asia (IDA & IBRD countries)European UnionFaroe IslandsFijiFinlandFragile and conflict affected situationsFranceFrench PolynesiaGabonGambia, TheGeorgiaGermanyGhanaGibraltarGreeceGreenlandGrenadaGuamGuatemalaGuineaGuinea-BissauGuyanaHaitiHeavily indebted poor countries (HIPC)High incomeHondurasHong Kong SAR, ChinaHungaryIBRD onlyIcelandIDA & IBRD totalIDA blendIDA onlyIDA totalIndiaIndonesiaIran, Islamic Rep.IraqIrelandIsle of ManIsraelItalyJamaicaJapanJordanKazakhstanKenyaKiribatiKorea, Dem. People’s Rep.Korea, Rep.KuwaitKyrgyz RepublicLao PDRLate-demographic dividendLatin America & Caribbean Latin America & Caribbean (excluding high income)Latin America & the Caribbean (IDA & IBRD countries)LatviaLeast developed countries: UN classificationLebanonLesothoLiberiaLibyaLiechtensteinLithuaniaLow & middle incomeLow incomeLower middle incomeLuxembourgMacao SAR, ChinaMacedonia, FYRMadagascarMalawiMalaysiaMaldivesMaliMaltaMarshall IslandsMauritaniaMauritiusMexicoMicronesia, Fed. Sts.Middle East & North AfricaMiddle East & North Africa (excluding high income)Middle East & North Africa (IDA & IBRD countries)Middle incomeMoldovaMonacoMongoliaMontenegroMoroccoMozambiqueMyanmarNamibiaNauruNepalNetherlandsNew CaledoniaNew ZealandNicaraguaNigerNigeriaNorth AmericaNorthern Mariana IslandsNorwayOECD membersOmanOther small statesPacific island small statesPakistanPalauPanamaPapua New GuineaParaguayPeruPhilippinesPolandPortugalPost-demographic dividendPre-demographic dividendPuerto RicoQatarRomaniaRussian FederationRwandaSamoaSan MarinoSao Tome and PrincipeSaudi ArabiaSenegalSerbiaSeychellesSierra LeoneSingaporeSint Maarten (Dutch part)Slovak RepublicSloveniaSmall statesSolomon IslandsSomaliaSouth AfricaSouth AsiaSouth Asia (IDA & IBRD)South SudanSpainSri LankaSt. Kitts and NevisSt. LuciaSt. Vincent and the GrenadinesSub-Saharan Africa Sub-Saharan Africa (excluding high income)Sub-Saharan Africa (IDA & IBRD countries)SudanSurinameSwazilandSwedenSwitzerlandSyrian Arab RepublicTajikistanTanzaniaThailandTimor-LesteTogoTongaTrinidad and TobagoTunisiaTurkeyTurkmenistanTurks and Caicos IslandsTuvaluUgandaUkraineUnited Arab EmiratesUnited KingdomUnited StatesUpper middle incomeUruguayUzbekistanVanuatuVenezuela, RBVietnamVirgin Islands (U.S.)West Bank and GazaWorldYemen, Rep.ZambiaZimbabwe Timeline:
This timeline shows a graph from 1961 to 2016 of Morocco. No data until 1960. Number of actual observations by date: 56.
Source name:
World Development Indicators
Source organization:
World Bank Staff estimates based on United Nations, World Urbanization Prospects.
Categories, topics:
Agriculture & Rural Development
Last updated:
apr 23, 2017
Indicators value changes by year
Minimum:
39.805
jan 1, 2016
Maximum:
70.643
jan 1, 1961
At the date of observation
Value
Absolute change
Change from previous value
jan 1, 1961
70.643
+70.643
0.0%
jan 1, 1962
70.151
-0.492
-0.7%
jan 1, 1963
69.655
-0.496
-0.71%
jan 1, 1964
69.154
-0.501
-0.72%
jan 1, 1965
68.647
-0.507
-0.73%
jan 1, 1966
68.138
-0.509
-0.74%
jan 1, 1967
67.623
-0.515
-0.76%
jan 1, 1968
67.104
-0.519
-0.77%
jan 1, 1969
66.581
-0.523
-0.78%
jan 1, 1970
66.054
-0.527
-0.79%
jan 1, 1971
65.523
-0.531
-0.8%
jan 1, 1972
64.988
-0.535
-0.82%
jan 1, 1973
64.325
-0.663
-1.02%
jan 1, 1974
63.651
-0.674
-1.05%
jan 1, 1975
62.971
-0.68
-1.07%
jan 1, 1976
62.286
-0.685
-1.09%
jan 1, 1977
61.595
-0.691
-1.11%
jan 1, 1978
60.901
-0.694
-1.13%
jan 1, 1979
60.202
-0.699
-1.15%
jan 1, 1980
59.498
-0.704
-1.17%
jan 1, 1981
58.79
-0.708
-1.19%
jan 1, 1982
58.08
-0.71
-1.21%
jan 1, 1983
57.366
-0.714
-1.23%
jan 1, 1984
56.653
-0.713
-1.24%
jan 1, 1985
55.937
-0.716
-1.26%
jan 1, 1986
55.221
-0.716
-1.28%
jan 1, 1987
54.502
-0.719
-1.3%
jan 1, 1988
53.781
-0.721
-1.32%
jan 1, 1989
53.057
-0.724
-1.35%
jan 1, 1990
52.334
-0.723
-1.36%
jan 1, 1991
51.609
-0.725
-1.39%
jan 1, 1992
50.883
-0.726
-1.41%
jan 1, 1993
50.156
-0.727
-1.43%
jan 1, 1994
49.431
-0.725
-1.45%
jan 1, 1995
48.705
-0.726
-1.47%
jan 1, 1996
48.308
-0.397
-0.82%
jan 1, 1997
47.978
-0.33
-0.68%
jan 1, 1998
47.65
-0.328
-0.68%
jan 1, 1999
47.322
-0.328
-0.69%
jan 1, 2000
46.993
-0.329
-0.7%
jan 1, 2001
46.665
-0.328
-0.7%
jan 1, 2002
46.338
-0.327
-0.7%
jan 1, 2003
46.01
-0.328
-0.71%
jan 1, 2004
45.683
-0.327
-0.71%
jan 1, 2005
45.356
-0.327
-0.72%
jan 1, 2006
44.874
-0.482
-1.06%
jan 1, 2007
44.36
-0.514
-1.15%
jan 1, 2008
43.847
-0.513
-1.16%
jan 1, 2009
43.335
-0.512
-1.17%
jan 1, 2010
42.825
-0.51
-1.18%
jan 1, 2011
42.316
-0.509
-1.19%
jan 1, 2012
41.809
-0.507
-1.2%
jan 1, 2013
41.303
-0.506
-1.21%
jan 1, 2014
40.8
-0.503
-1.22%
jan 1, 2015
40.301
-0.499
-1.22%
jan 1, 2016
39.805
-0.496
-1.23%
Ranking of countries by current statistics by years


Comments: