29
/
en
AIzaSyAYiBZKx7MnpbEhh9jyipgxe19OcubqV5w
April 1, 2024
247117
South Sudan
SSD
true
2
1
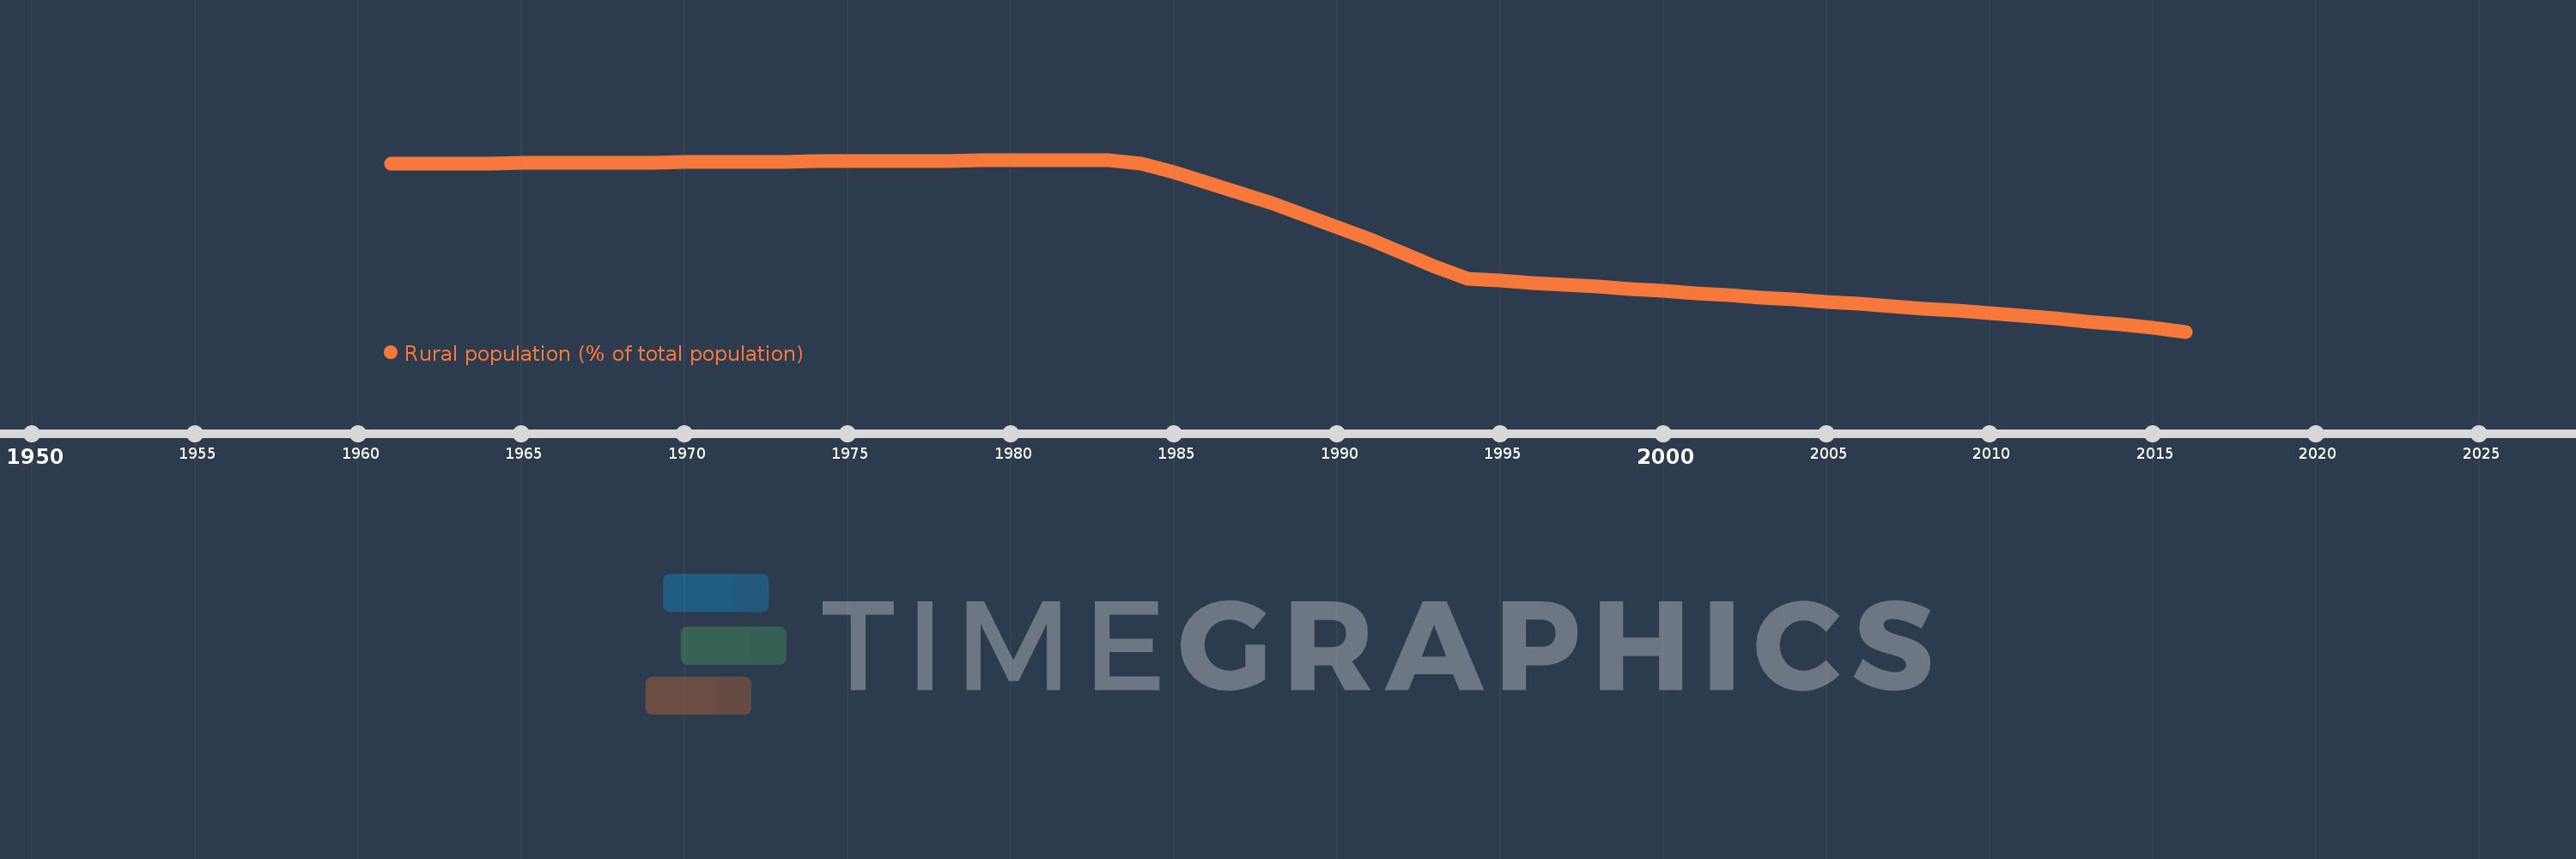
Rural population (% of total population)
2016,2015,2014,2013,2012,2011,2010,2009,2008,2007,2006,2005,2004,2003,2002,2001,2000,1999,1998,1997,1996,1995,1994,1993,1992,1991,1990,1989,1988,1987,1986,1985,1984,1983,1982,1981,1980,1979,1978,1977,1976,1975,1974,1973,1972,1971,1970,1969,1968,1967,1966,1965,1964,1963,1962,1961
This statistics in other country:
AfghanistanAlbaniaAlgeriaAmerican SamoaAndorraAngolaAntigua and BarbudaArab WorldArgentinaArmeniaArubaAustraliaAustriaAzerbaijanBahamas, TheBahrainBangladeshBarbadosBelarusBelgiumBelizeBeninBermudaBhutanBoliviaBosnia and HerzegovinaBotswanaBrazilBritish Virgin IslandsBrunei DarussalamBulgariaBurkina FasoBurundiCabo VerdeCambodiaCameroonCanadaCaribbean small statesCayman IslandsCentral African RepublicCentral Europe and the BalticsChadChannel IslandsChileChinaColombiaComorosCongo, Dem. Rep.Congo, Rep.Costa RicaCote d'IvoireCroatiaCubaCuracaoCyprusCzech RepublicDenmarkDjiboutiDominicaDominican RepublicEarly-demographic dividendEast Asia & PacificEast Asia & Pacific (excluding high income)East Asia & Pacific (IDA & IBRD countries)EcuadorEgypt, Arab Rep.El SalvadorEquatorial GuineaEritreaEstoniaEthiopiaEuro areaEurope & Central AsiaEurope & Central Asia (excluding high income)Europe & Central Asia (IDA & IBRD countries)European UnionFaroe IslandsFijiFinlandFragile and conflict affected situationsFranceFrench PolynesiaGabonGambia, TheGeorgiaGermanyGhanaGibraltarGreeceGreenlandGrenadaGuamGuatemalaGuineaGuinea-BissauGuyanaHaitiHeavily indebted poor countries (HIPC)High incomeHondurasHong Kong SAR, ChinaHungaryIBRD onlyIcelandIDA & IBRD totalIDA blendIDA onlyIDA totalIndiaIndonesiaIran, Islamic Rep.IraqIrelandIsle of ManIsraelItalyJamaicaJapanJordanKazakhstanKenyaKiribatiKorea, Dem. People’s Rep.Korea, Rep.KuwaitKyrgyz RepublicLao PDRLate-demographic dividendLatin America & Caribbean Latin America & Caribbean (excluding high income)Latin America & the Caribbean (IDA & IBRD countries)LatviaLeast developed countries: UN classificationLebanonLesothoLiberiaLibyaLiechtensteinLithuaniaLow & middle incomeLow incomeLower middle incomeLuxembourgMacao SAR, ChinaMacedonia, FYRMadagascarMalawiMalaysiaMaldivesMaliMaltaMarshall IslandsMauritaniaMauritiusMexicoMicronesia, Fed. Sts.Middle East & North AfricaMiddle East & North Africa (excluding high income)Middle East & North Africa (IDA & IBRD countries)Middle incomeMoldovaMonacoMongoliaMontenegroMoroccoMozambiqueMyanmarNamibiaNauruNepalNetherlandsNew CaledoniaNew ZealandNicaraguaNigerNigeriaNorth AmericaNorthern Mariana IslandsNorwayOECD membersOmanOther small statesPacific island small statesPakistanPalauPanamaPapua New GuineaParaguayPeruPhilippinesPolandPortugalPost-demographic dividendPre-demographic dividendPuerto RicoQatarRomaniaRussian FederationRwandaSamoaSan MarinoSao Tome and PrincipeSaudi ArabiaSenegalSerbiaSeychellesSierra LeoneSingaporeSint Maarten (Dutch part)Slovak RepublicSloveniaSmall statesSolomon IslandsSomaliaSouth AfricaSouth AsiaSouth Asia (IDA & IBRD)South SudanSpainSri LankaSt. Kitts and NevisSt. LuciaSt. Vincent and the GrenadinesSub-Saharan Africa Sub-Saharan Africa (excluding high income)Sub-Saharan Africa (IDA & IBRD countries)SudanSurinameSwazilandSwedenSwitzerlandSyrian Arab RepublicTajikistanTanzaniaThailandTimor-LesteTogoTongaTrinidad and TobagoTunisiaTurkeyTurkmenistanTurks and Caicos IslandsTuvaluUgandaUkraineUnited Arab EmiratesUnited KingdomUnited StatesUpper middle incomeUruguayUzbekistanVanuatuVenezuela, RBVietnamVirgin Islands (U.S.)West Bank and GazaWorldYemen, Rep.ZambiaZimbabwe Timeline:
This timeline shows a graph from 1961 to 2016 of South Sudan. No data until 1960. Number of actual observations by date: 56.
Source name:
World Development Indicators
Source organization:
World Bank Staff estimates based on United Nations, World Urbanization Prospects.
Categories, topics:
Agriculture & Rural Development
Last updated:
apr 23, 2017
Indicators value changes by year
Minimum:
81.196
jan 1, 2016
Maximum:
91.503
jan 1, 1983
At the date of observation
Value
Absolute change
Change from previous value
jan 1, 1961
91.252
+91.252
0.0%
jan 1, 1962
91.263
+0.011
0.01%
jan 1, 1963
91.275
+0.012
0.01%
jan 1, 1964
91.286
+0.011
0.01%
jan 1, 1965
91.298
+0.012
0.01%
jan 1, 1966
91.31
+0.012
0.01%
jan 1, 1967
91.321
+0.011
0.01%
jan 1, 1968
91.333
+0.012
0.01%
jan 1, 1969
91.344
+0.011
0.01%
jan 1, 1970
91.355
+0.011
0.01%
jan 1, 1971
91.367
+0.012
0.01%
jan 1, 1972
91.378
+0.011
0.01%
jan 1, 1973
91.39
+0.012
0.01%
jan 1, 1974
91.401
+0.011
0.01%
jan 1, 1975
91.413
+0.012
0.01%
jan 1, 1976
91.424
+0.011
0.01%
jan 1, 1977
91.435
+0.011
0.01%
jan 1, 1978
91.447
+0.012
0.01%
jan 1, 1979
91.458
+0.011
0.01%
jan 1, 1980
91.469
+0.011
0.01%
jan 1, 1981
91.481
+0.012
0.01%
jan 1, 1982
91.492
+0.011
0.01%
jan 1, 1983
91.503
+0.011
0.01%
jan 1, 1984
91.292
-0.211
-0.23%
jan 1, 1985
90.739
-0.553
-0.61%
jan 1, 1986
90.156
-0.583
-0.64%
jan 1, 1987
89.539
-0.617
-0.68%
jan 1, 1988
88.889
-0.65
-0.73%
jan 1, 1989
88.203
-0.686
-0.77%
jan 1, 1990
87.483
-0.72
-0.82%
jan 1, 1991
86.724
-0.759
-0.87%
jan 1, 1992
85.926
-0.798
-0.92%
jan 1, 1993
85.088
-0.838
-0.98%
jan 1, 1994
84.374
-0.714
-0.84%
jan 1, 1995
84.251
-0.123
-0.15%
jan 1, 1996
84.127
-0.124
-0.15%
jan 1, 1997
84.003
-0.124
-0.15%
jan 1, 1998
83.877
-0.126
-0.15%
jan 1, 1999
83.751
-0.126
-0.15%
jan 1, 2000
83.624
-0.127
-0.15%
jan 1, 2001
83.496
-0.128
-0.15%
jan 1, 2002
83.368
-0.128
-0.15%
jan 1, 2003
83.239
-0.129
-0.15%
jan 1, 2004
83.109
-0.13
-0.16%
jan 1, 2005
82.977
-0.132
-0.16%
jan 1, 2006
82.846
-0.131
-0.16%
jan 1, 2007
82.713
-0.133
-0.16%
jan 1, 2008
82.58
-0.133
-0.16%
jan 1, 2009
82.445
-0.135
-0.16%
jan 1, 2010
82.301
-0.144
-0.17%
jan 1, 2011
82.145
-0.156
-0.19%
jan 1, 2012
81.978
-0.167
-0.2%
jan 1, 2013
81.8
-0.178
-0.22%
jan 1, 2014
81.61
-0.19
-0.23%
jan 1, 2015
81.409
-0.201
-0.25%
jan 1, 2016
81.196
-0.213
-0.26%
Ranking of countries by current statistics by years


Comments: