29
/
en
AIzaSyAYiBZKx7MnpbEhh9jyipgxe19OcubqV5w
April 1, 2024
131591
Faroe Islands
FRO
true
2
1
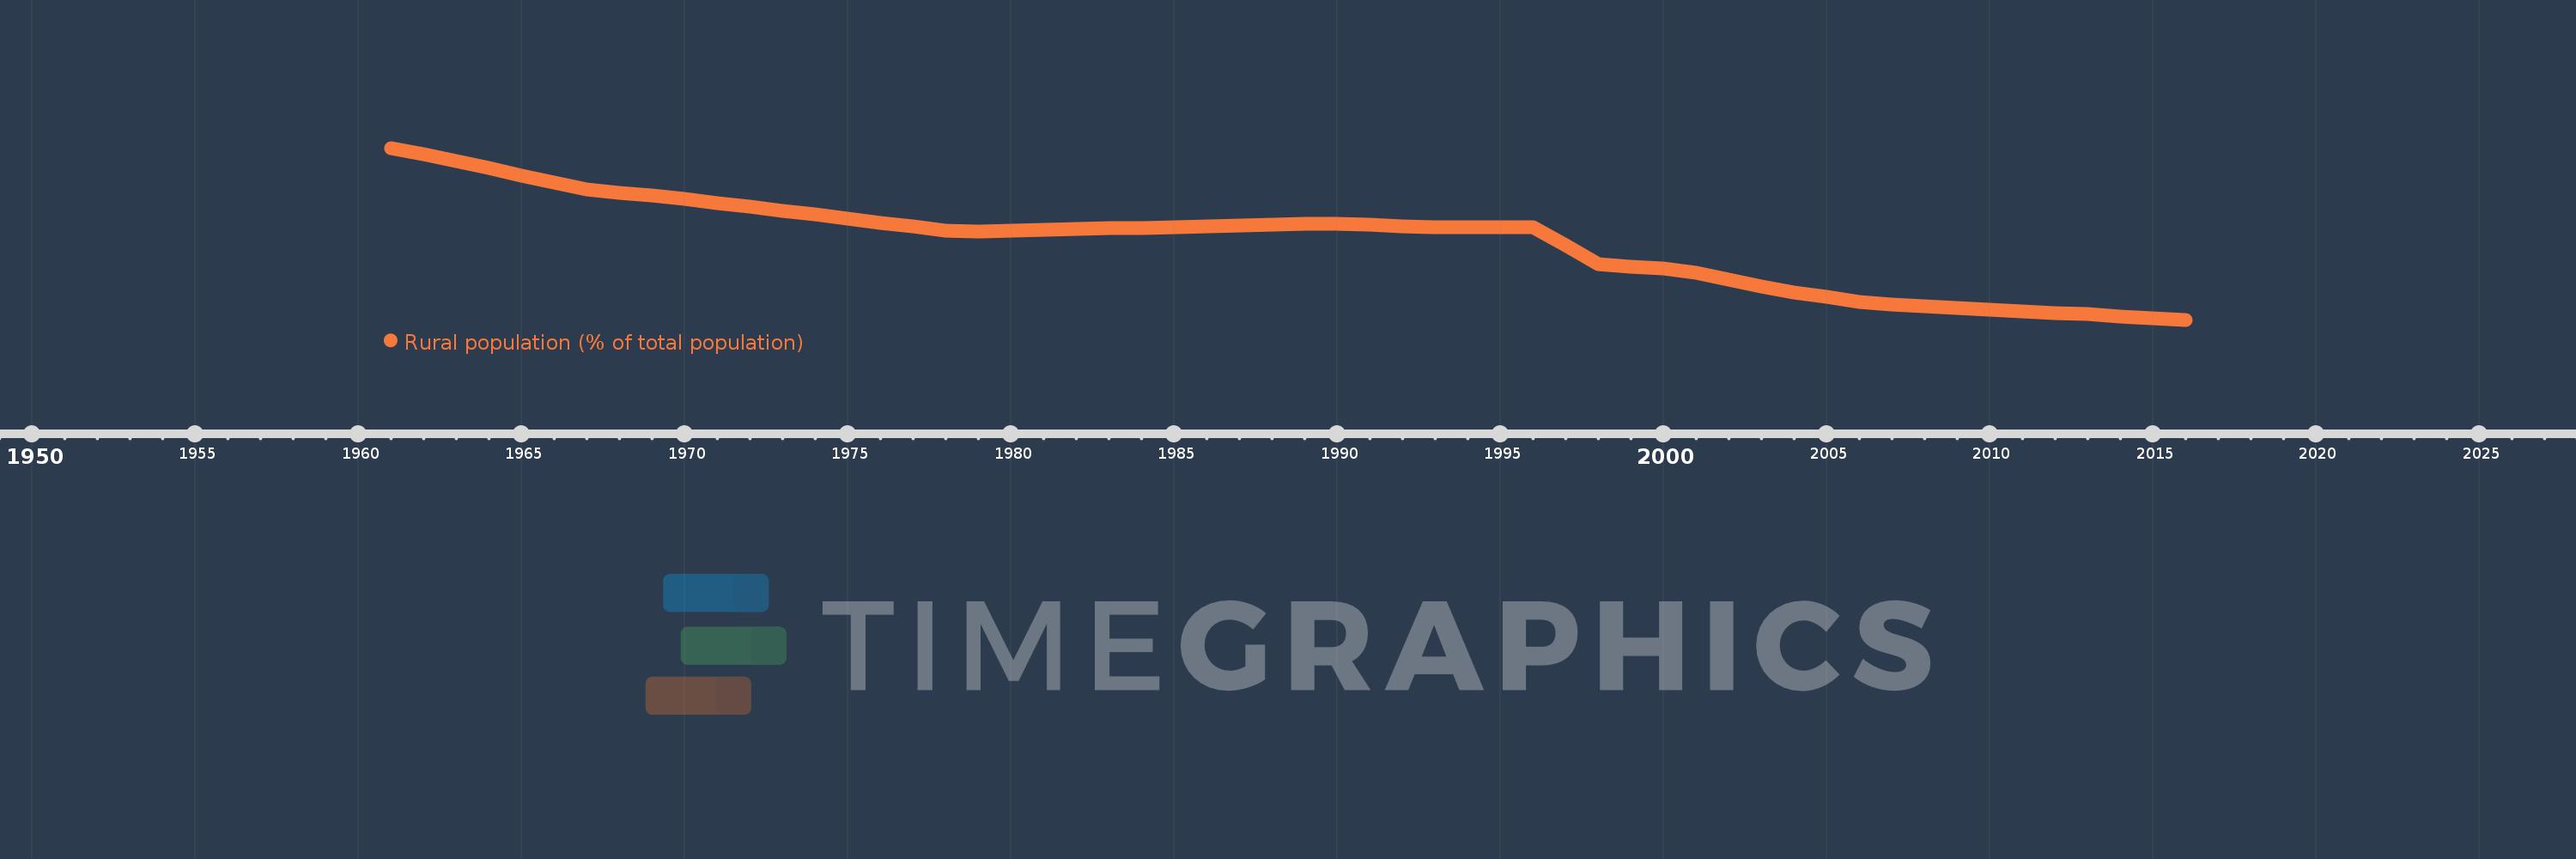
Rural population (% of total population)
2016,2015,2014,2013,2012,2011,2010,2009,2008,2007,2006,2005,2004,2003,2002,2001,2000,1999,1998,1997,1996,1995,1994,1993,1992,1991,1990,1989,1988,1987,1986,1985,1984,1983,1982,1981,1980,1979,1978,1977,1976,1975,1974,1973,1972,1971,1970,1969,1968,1967,1966,1965,1964,1963,1962,1961
This statistics in other country:
AfghanistanAlbaniaAlgeriaAmerican SamoaAndorraAngolaAntigua and BarbudaArab WorldArgentinaArmeniaArubaAustraliaAustriaAzerbaijanBahamas, TheBahrainBangladeshBarbadosBelarusBelgiumBelizeBeninBermudaBhutanBoliviaBosnia and HerzegovinaBotswanaBrazilBritish Virgin IslandsBrunei DarussalamBulgariaBurkina FasoBurundiCabo VerdeCambodiaCameroonCanadaCaribbean small statesCayman IslandsCentral African RepublicCentral Europe and the BalticsChadChannel IslandsChileChinaColombiaComorosCongo, Dem. Rep.Congo, Rep.Costa RicaCote d'IvoireCroatiaCubaCuracaoCyprusCzech RepublicDenmarkDjiboutiDominicaDominican RepublicEarly-demographic dividendEast Asia & PacificEast Asia & Pacific (excluding high income)East Asia & Pacific (IDA & IBRD countries)EcuadorEgypt, Arab Rep.El SalvadorEquatorial GuineaEritreaEstoniaEthiopiaEuro areaEurope & Central AsiaEurope & Central Asia (excluding high income)Europe & Central Asia (IDA & IBRD countries)European UnionFaroe IslandsFijiFinlandFragile and conflict affected situationsFranceFrench PolynesiaGabonGambia, TheGeorgiaGermanyGhanaGibraltarGreeceGreenlandGrenadaGuamGuatemalaGuineaGuinea-BissauGuyanaHaitiHeavily indebted poor countries (HIPC)High incomeHondurasHong Kong SAR, ChinaHungaryIBRD onlyIcelandIDA & IBRD totalIDA blendIDA onlyIDA totalIndiaIndonesiaIran, Islamic Rep.IraqIrelandIsle of ManIsraelItalyJamaicaJapanJordanKazakhstanKenyaKiribatiKorea, Dem. People’s Rep.Korea, Rep.KuwaitKyrgyz RepublicLao PDRLate-demographic dividendLatin America & Caribbean Latin America & Caribbean (excluding high income)Latin America & the Caribbean (IDA & IBRD countries)LatviaLeast developed countries: UN classificationLebanonLesothoLiberiaLibyaLiechtensteinLithuaniaLow & middle incomeLow incomeLower middle incomeLuxembourgMacao SAR, ChinaMacedonia, FYRMadagascarMalawiMalaysiaMaldivesMaliMaltaMarshall IslandsMauritaniaMauritiusMexicoMicronesia, Fed. Sts.Middle East & North AfricaMiddle East & North Africa (excluding high income)Middle East & North Africa (IDA & IBRD countries)Middle incomeMoldovaMonacoMongoliaMontenegroMoroccoMozambiqueMyanmarNamibiaNauruNepalNetherlandsNew CaledoniaNew ZealandNicaraguaNigerNigeriaNorth AmericaNorthern Mariana IslandsNorwayOECD membersOmanOther small statesPacific island small statesPakistanPalauPanamaPapua New GuineaParaguayPeruPhilippinesPolandPortugalPost-demographic dividendPre-demographic dividendPuerto RicoQatarRomaniaRussian FederationRwandaSamoaSan MarinoSao Tome and PrincipeSaudi ArabiaSenegalSerbiaSeychellesSierra LeoneSingaporeSint Maarten (Dutch part)Slovak RepublicSloveniaSmall statesSolomon IslandsSomaliaSouth AfricaSouth AsiaSouth Asia (IDA & IBRD)South SudanSpainSri LankaSt. Kitts and NevisSt. LuciaSt. Vincent and the GrenadinesSub-Saharan Africa Sub-Saharan Africa (excluding high income)Sub-Saharan Africa (IDA & IBRD countries)SudanSurinameSwazilandSwedenSwitzerlandSyrian Arab RepublicTajikistanTanzaniaThailandTimor-LesteTogoTongaTrinidad and TobagoTunisiaTurkeyTurkmenistanTurks and Caicos IslandsTuvaluUgandaUkraineUnited Arab EmiratesUnited KingdomUnited StatesUpper middle incomeUruguayUzbekistanVanuatuVenezuela, RBVietnamVirgin Islands (U.S.)West Bank and GazaWorldYemen, Rep.ZambiaZimbabwe Timeline:
This timeline shows a graph from 1961 to 2016 of Faroe Islands. No data until 1960. Number of actual observations by date: 56.
Source name:
World Development Indicators
Source organization:
World Bank Staff estimates based on United Nations, World Urbanization Prospects.
Categories, topics:
Agriculture & Rural Development
Last updated:
apr 23, 2017
Indicators value changes by year
Minimum:
58.038
jan 1, 2016
Maximum:
78.617
jan 1, 1961
At the date of observation
Value
Absolute change
Change from previous value
jan 1, 1961
78.617
+78.617
0.0%
jan 1, 1962
77.859
-0.758
-0.96%
jan 1, 1963
77.038
-0.821
-1.05%
jan 1, 1964
76.195
-0.843
-1.09%
jan 1, 1965
75.331
-0.864
-1.13%
jan 1, 1966
74.447
-0.884
-1.17%
jan 1, 1967
73.672
-0.775
-1.04%
jan 1, 1968
73.277
-0.395
-0.54%
jan 1, 1969
72.878
-0.399
-0.54%
jan 1, 1970
72.476
-0.402
-0.55%
jan 1, 1971
72.049
-0.427
-0.59%
jan 1, 1972
71.583
-0.466
-0.65%
jan 1, 1973
71.112
-0.471
-0.66%
jan 1, 1974
70.638
-0.474
-0.67%
jan 1, 1975
70.158
-0.48
-0.68%
jan 1, 1976
69.674
-0.484
-0.69%
jan 1, 1977
69.185
-0.489
-0.7%
jan 1, 1978
68.693
-0.492
-0.71%
jan 1, 1979
68.645
-0.048
-0.07%
jan 1, 1980
68.73
+0.085
0.12%
jan 1, 1981
68.814
+0.084
0.12%
jan 1, 1982
68.899
+0.085
0.12%
jan 1, 1983
68.983
+0.084
0.12%
jan 1, 1984
69.067
+0.084
0.12%
jan 1, 1985
69.151
+0.084
0.12%
jan 1, 1986
69.234
+0.083
0.12%
jan 1, 1987
69.318
+0.084
0.12%
jan 1, 1988
69.402
+0.084
0.12%
jan 1, 1989
69.485
+0.083
0.12%
jan 1, 1990
69.568
+0.083
0.12%
jan 1, 1991
69.406
-0.162
-0.23%
jan 1, 1992
69.186
-0.22
-0.32%
jan 1, 1993
69.158
-0.028
-0.04%
jan 1, 1994
69.13
-0.028
-0.04%
jan 1, 1995
69.102
-0.028
-0.04%
jan 1, 1996
69.074
-0.028
-0.04%
jan 1, 1997
66.965
-2.109
-3.05%
jan 1, 1998
64.646
-2.319
-3.46%
jan 1, 1999
64.346
-0.3
-0.46%
jan 1, 2000
64.14
-0.206
-0.32%
jan 1, 2001
63.663
-0.477
-0.74%
jan 1, 2002
62.825
-0.838
-1.32%
jan 1, 2003
61.978
-0.847
-1.35%
jan 1, 2004
61.286
-0.692
-1.12%
jan 1, 2005
60.753
-0.533
-0.87%
jan 1, 2006
60.219
-0.534
-0.88%
jan 1, 2007
59.853
-0.366
-0.61%
jan 1, 2008
59.659
-0.194
-0.32%
jan 1, 2009
59.464
-0.195
-0.33%
jan 1, 2010
59.269
-0.195
-0.33%
jan 1, 2011
59.074
-0.195
-0.33%
jan 1, 2012
58.878
-0.196
-0.33%
jan 1, 2013
58.677
-0.201
-0.34%
jan 1, 2014
58.47
-0.207
-0.35%
jan 1, 2015
58.257
-0.213
-0.36%
jan 1, 2016
58.038
-0.219
-0.38%
Ranking of countries by current statistics by years


Comments: