29
/
en
AIzaSyAYiBZKx7MnpbEhh9jyipgxe19OcubqV5w
April 1, 2024
104212
Chad
TCD
true
2
1
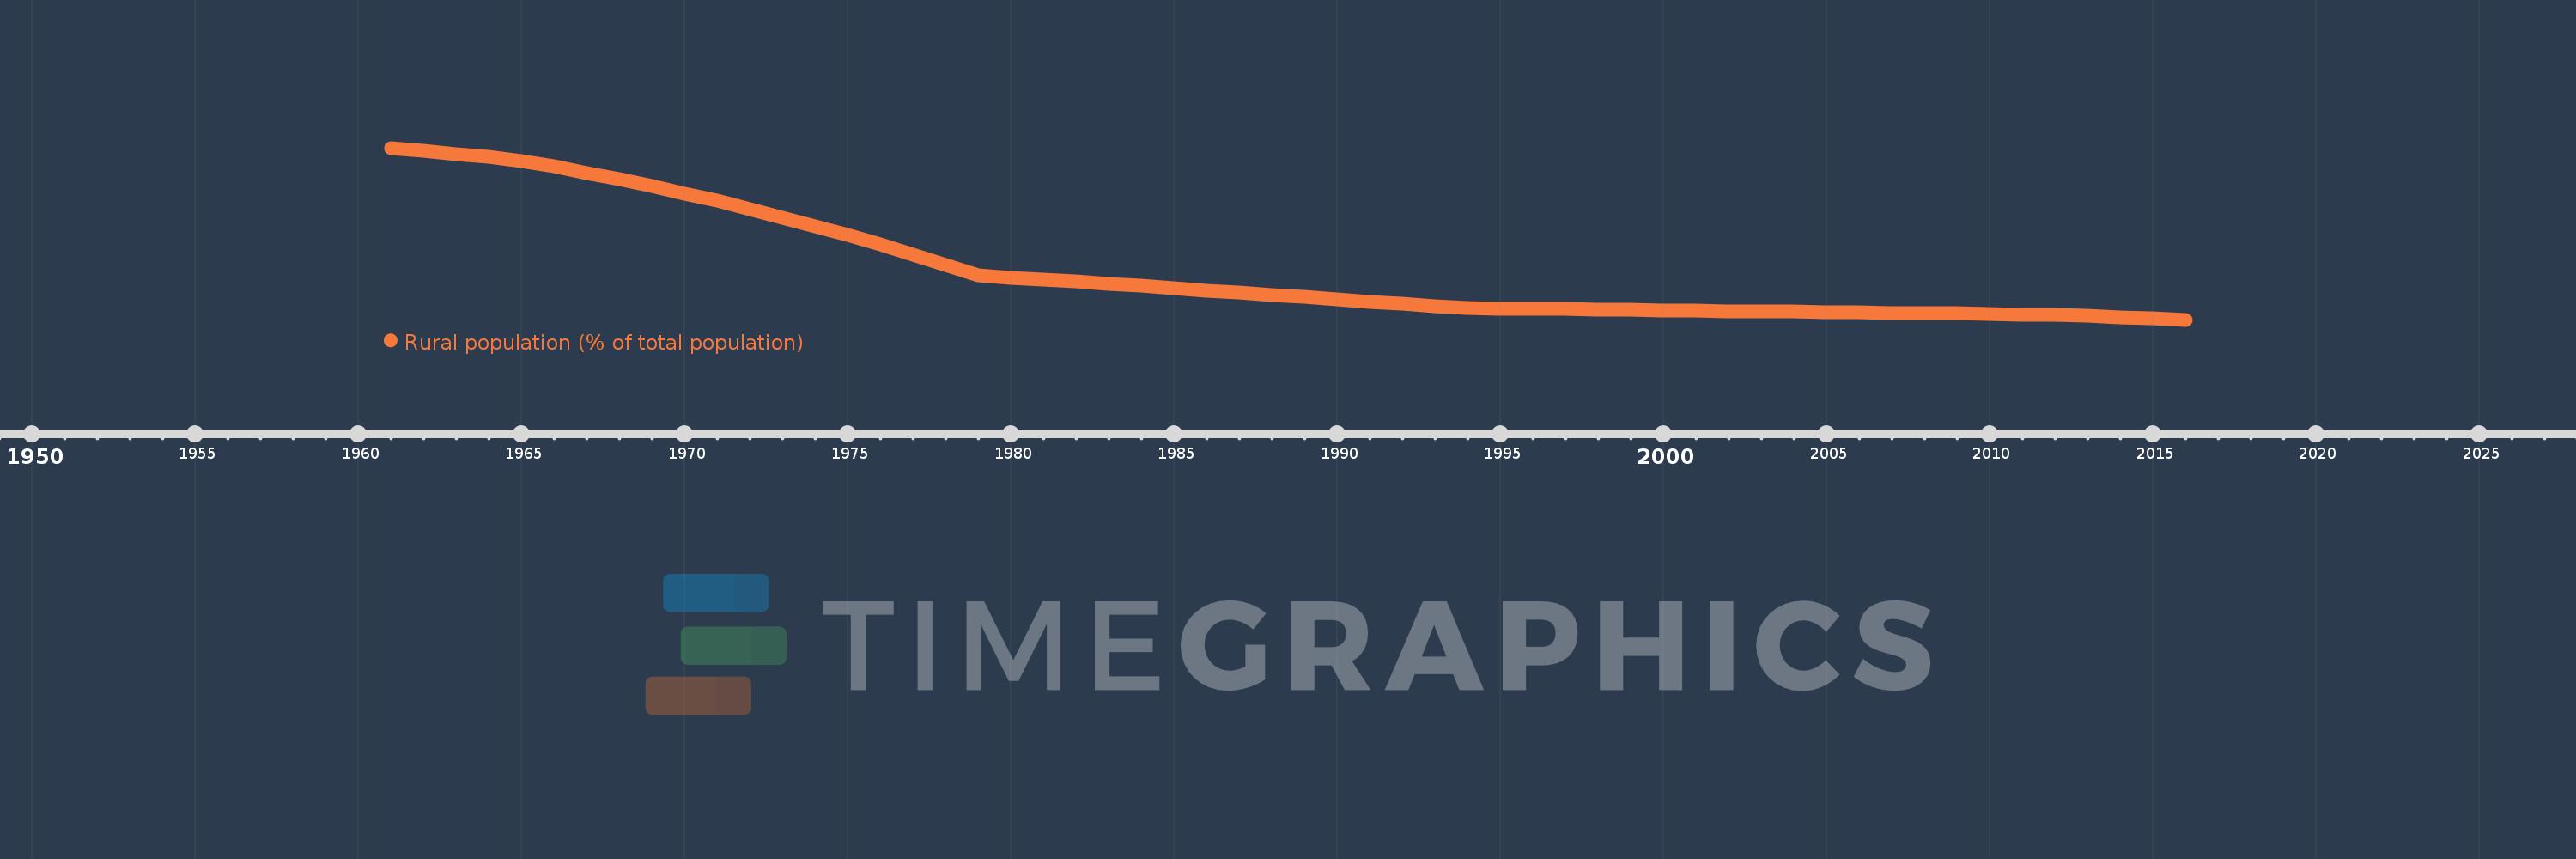
Rural population (% of total population)
2016,2015,2014,2013,2012,2011,2010,2009,2008,2007,2006,2005,2004,2003,2002,2001,2000,1999,1998,1997,1996,1995,1994,1993,1992,1991,1990,1989,1988,1987,1986,1985,1984,1983,1982,1981,1980,1979,1978,1977,1976,1975,1974,1973,1972,1971,1970,1969,1968,1967,1966,1965,1964,1963,1962,1961
This statistics in other country:
AfghanistanAlbaniaAlgeriaAmerican SamoaAndorraAngolaAntigua and BarbudaArab WorldArgentinaArmeniaArubaAustraliaAustriaAzerbaijanBahamas, TheBahrainBangladeshBarbadosBelarusBelgiumBelizeBeninBermudaBhutanBoliviaBosnia and HerzegovinaBotswanaBrazilBritish Virgin IslandsBrunei DarussalamBulgariaBurkina FasoBurundiCabo VerdeCambodiaCameroonCanadaCaribbean small statesCayman IslandsCentral African RepublicCentral Europe and the BalticsChadChannel IslandsChileChinaColombiaComorosCongo, Dem. Rep.Congo, Rep.Costa RicaCote d'IvoireCroatiaCubaCuracaoCyprusCzech RepublicDenmarkDjiboutiDominicaDominican RepublicEarly-demographic dividendEast Asia & PacificEast Asia & Pacific (excluding high income)East Asia & Pacific (IDA & IBRD countries)EcuadorEgypt, Arab Rep.El SalvadorEquatorial GuineaEritreaEstoniaEthiopiaEuro areaEurope & Central AsiaEurope & Central Asia (excluding high income)Europe & Central Asia (IDA & IBRD countries)European UnionFaroe IslandsFijiFinlandFragile and conflict affected situationsFranceFrench PolynesiaGabonGambia, TheGeorgiaGermanyGhanaGibraltarGreeceGreenlandGrenadaGuamGuatemalaGuineaGuinea-BissauGuyanaHaitiHeavily indebted poor countries (HIPC)High incomeHondurasHong Kong SAR, ChinaHungaryIBRD onlyIcelandIDA & IBRD totalIDA blendIDA onlyIDA totalIndiaIndonesiaIran, Islamic Rep.IraqIrelandIsle of ManIsraelItalyJamaicaJapanJordanKazakhstanKenyaKiribatiKorea, Dem. People’s Rep.Korea, Rep.KuwaitKyrgyz RepublicLao PDRLate-demographic dividendLatin America & Caribbean Latin America & Caribbean (excluding high income)Latin America & the Caribbean (IDA & IBRD countries)LatviaLeast developed countries: UN classificationLebanonLesothoLiberiaLibyaLiechtensteinLithuaniaLow & middle incomeLow incomeLower middle incomeLuxembourgMacao SAR, ChinaMacedonia, FYRMadagascarMalawiMalaysiaMaldivesMaliMaltaMarshall IslandsMauritaniaMauritiusMexicoMicronesia, Fed. Sts.Middle East & North AfricaMiddle East & North Africa (excluding high income)Middle East & North Africa (IDA & IBRD countries)Middle incomeMoldovaMonacoMongoliaMontenegroMoroccoMozambiqueMyanmarNamibiaNauruNepalNetherlandsNew CaledoniaNew ZealandNicaraguaNigerNigeriaNorth AmericaNorthern Mariana IslandsNorwayOECD membersOmanOther small statesPacific island small statesPakistanPalauPanamaPapua New GuineaParaguayPeruPhilippinesPolandPortugalPost-demographic dividendPre-demographic dividendPuerto RicoQatarRomaniaRussian FederationRwandaSamoaSan MarinoSao Tome and PrincipeSaudi ArabiaSenegalSerbiaSeychellesSierra LeoneSingaporeSint Maarten (Dutch part)Slovak RepublicSloveniaSmall statesSolomon IslandsSomaliaSouth AfricaSouth AsiaSouth Asia (IDA & IBRD)South SudanSpainSri LankaSt. Kitts and NevisSt. LuciaSt. Vincent and the GrenadinesSub-Saharan Africa Sub-Saharan Africa (excluding high income)Sub-Saharan Africa (IDA & IBRD countries)SudanSurinameSwazilandSwedenSwitzerlandSyrian Arab RepublicTajikistanTanzaniaThailandTimor-LesteTogoTongaTrinidad and TobagoTunisiaTurkeyTurkmenistanTurks and Caicos IslandsTuvaluUgandaUkraineUnited Arab EmiratesUnited KingdomUnited StatesUpper middle incomeUruguayUzbekistanVanuatuVenezuela, RBVietnamVirgin Islands (U.S.)West Bank and GazaWorldYemen, Rep.ZambiaZimbabwe Timeline:
This timeline shows a graph from 1961 to 2016 of Chad. No data until 1960. Number of actual observations by date: 56.
Source name:
World Development Indicators
Source organization:
World Bank Staff estimates based on United Nations, World Urbanization Prospects.
Categories, topics:
Agriculture & Rural Development
Last updated:
apr 23, 2017
Indicators value changes by year
Minimum:
77.529
jan 1, 2016
Maximum:
93.305
jan 1, 1961
At the date of observation
Value
Absolute change
Change from previous value
jan 1, 1961
93.305
+93.305
0.0%
jan 1, 1962
93.038
-0.267
-0.29%
jan 1, 1963
92.761
-0.277
-0.3%
jan 1, 1964
92.473
-0.288
-0.31%
jan 1, 1965
92.123
-0.35
-0.38%
jan 1, 1966
91.594
-0.529
-0.57%
jan 1, 1967
91.032
-0.562
-0.61%
jan 1, 1968
90.436
-0.596
-0.65%
jan 1, 1969
89.804
-0.632
-0.7%
jan 1, 1970
89.138
-0.666
-0.74%
jan 1, 1971
88.432
-0.706
-0.79%
jan 1, 1972
87.687
-0.745
-0.84%
jan 1, 1973
86.9
-0.787
-0.9%
jan 1, 1974
86.118
-0.782
-0.9%
jan 1, 1975
85.296
-0.822
-0.95%
jan 1, 1976
84.434
-0.862
-1.01%
jan 1, 1977
83.53
-0.904
-1.07%
jan 1, 1978
82.587
-0.943
-1.13%
jan 1, 1979
81.6
-0.987
-1.2%
jan 1, 1980
81.408
-0.192
-0.24%
jan 1, 1981
81.213
-0.195
-0.24%
jan 1, 1982
81.018
-0.195
-0.24%
jan 1, 1983
80.821
-0.197
-0.24%
jan 1, 1984
80.623
-0.198
-0.24%
jan 1, 1985
80.422
-0.201
-0.25%
jan 1, 1986
80.221
-0.201
-0.25%
jan 1, 1987
80.017
-0.204
-0.25%
jan 1, 1988
79.813
-0.204
-0.25%
jan 1, 1989
79.606
-0.207
-0.26%
jan 1, 1990
79.398
-0.208
-0.26%
jan 1, 1991
79.189
-0.209
-0.26%
jan 1, 1992
78.977
-0.212
-0.27%
jan 1, 1993
78.765
-0.212
-0.27%
jan 1, 1994
78.592
-0.173
-0.22%
jan 1, 1995
78.56
-0.032
-0.04%
jan 1, 1996
78.527
-0.033
-0.04%
jan 1, 1997
78.494
-0.033
-0.04%
jan 1, 1998
78.462
-0.032
-0.04%
jan 1, 1999
78.429
-0.033
-0.04%
jan 1, 2000
78.396
-0.033
-0.04%
jan 1, 2001
78.363
-0.033
-0.04%
jan 1, 2002
78.33
-0.033
-0.04%
jan 1, 2003
78.298
-0.032
-0.04%
jan 1, 2004
78.265
-0.033
-0.04%
jan 1, 2005
78.232
-0.033
-0.04%
jan 1, 2006
78.199
-0.033
-0.04%
jan 1, 2007
78.166
-0.033
-0.04%
jan 1, 2008
78.132
-0.034
-0.04%
jan 1, 2009
78.099
-0.033
-0.04%
jan 1, 2010
78.066
-0.033
-0.04%
jan 1, 2011
78.017
-0.049
-0.06%
jan 1, 2012
77.952
-0.065
-0.08%
jan 1, 2013
77.871
-0.081
-0.1%
jan 1, 2014
77.773
-0.098
-0.13%
jan 1, 2015
77.659
-0.114
-0.15%
jan 1, 2016
77.529
-0.13
-0.17%
Ranking of countries by current statistics by years


Comments: