29
/
en
AIzaSyAYiBZKx7MnpbEhh9jyipgxe19OcubqV5w
April 1, 2024
72509
Aruba
ABW
true
2
1
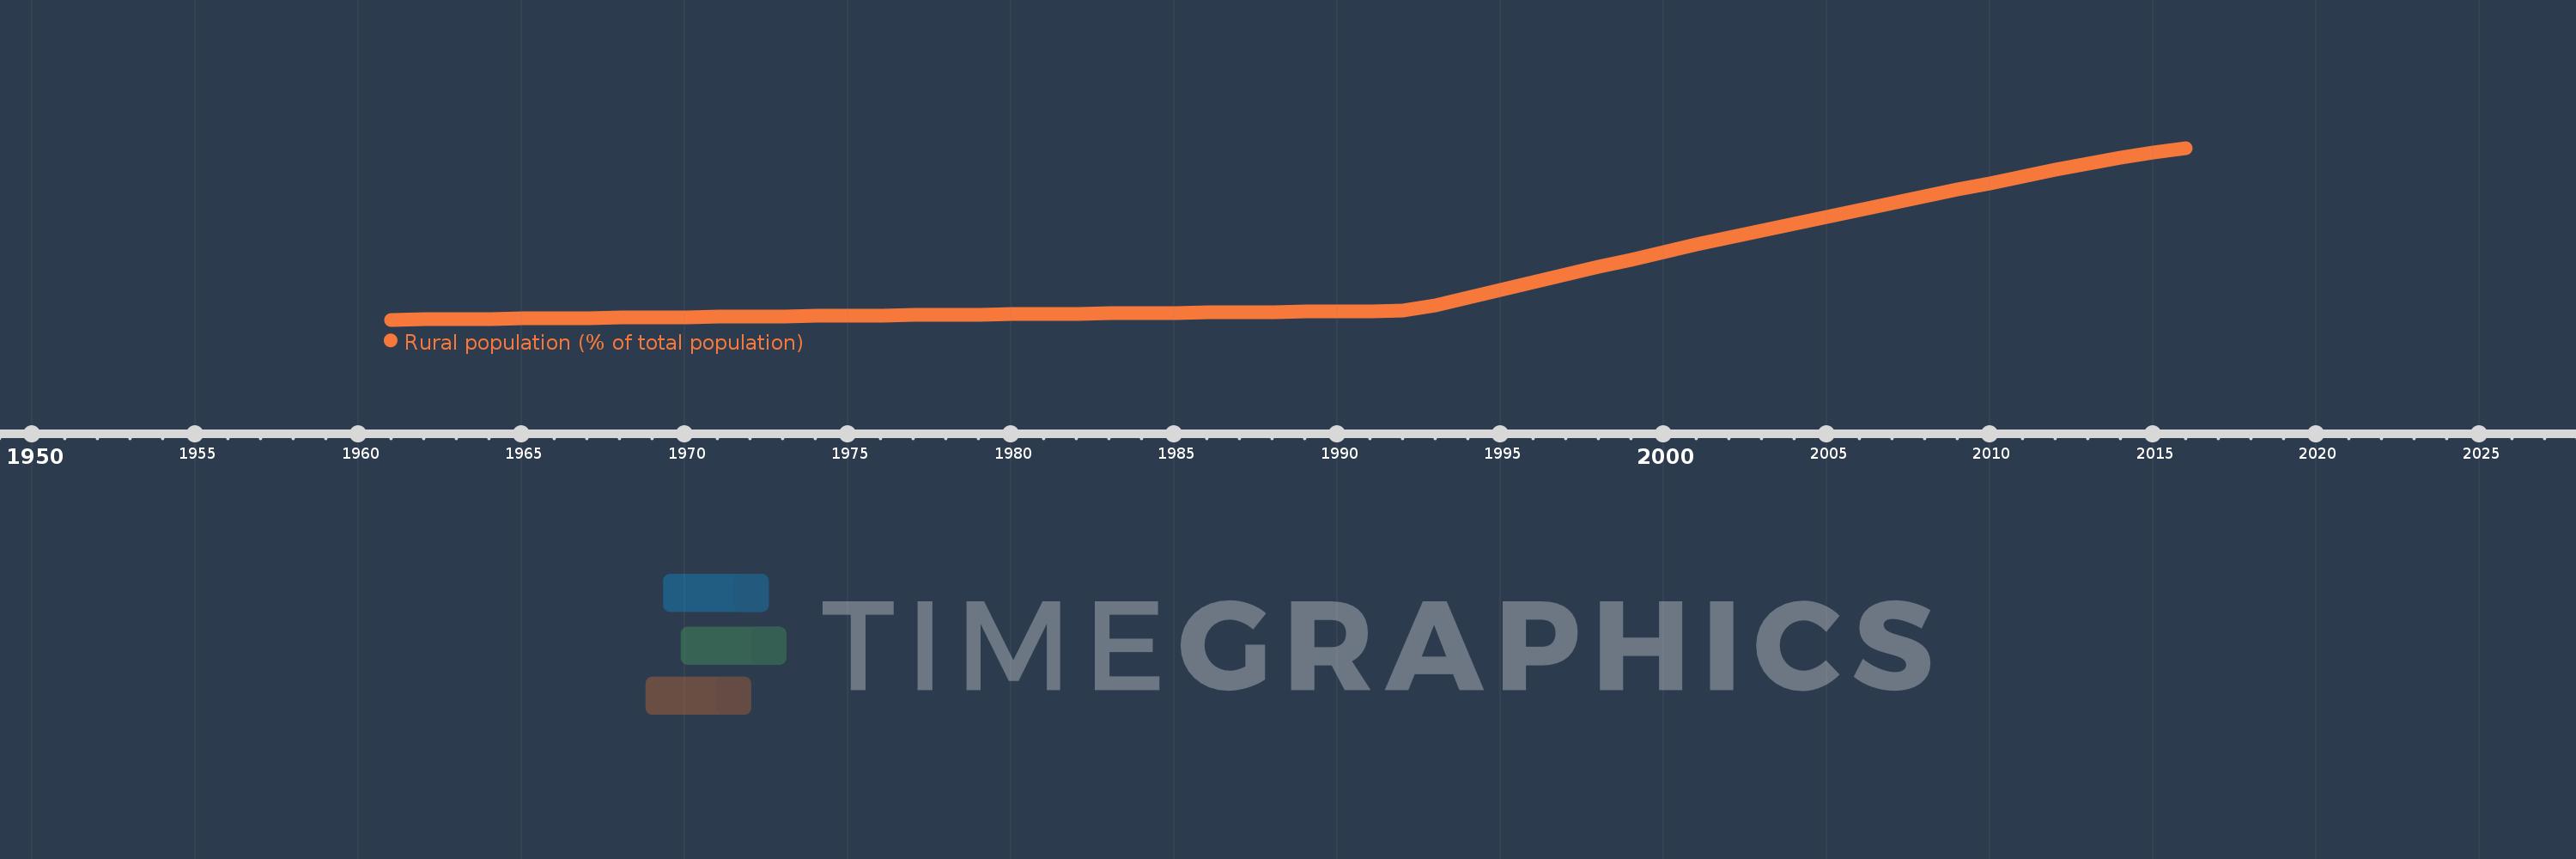
Rural population (% of total population)
2016,2015,2014,2013,2012,2011,2010,2009,2008,2007,2006,2005,2004,2003,2002,2001,2000,1999,1998,1997,1996,1995,1994,1993,1992,1991,1990,1989,1988,1987,1986,1985,1984,1983,1982,1981,1980,1979,1978,1977,1976,1975,1974,1973,1972,1971,1970,1969,1968,1967,1966,1965,1964,1963,1962,1961
This statistics in other country:
AfghanistanAlbaniaAlgeriaAmerican SamoaAndorraAngolaAntigua and BarbudaArab WorldArgentinaArmeniaArubaAustraliaAustriaAzerbaijanBahamas, TheBahrainBangladeshBarbadosBelarusBelgiumBelizeBeninBermudaBhutanBoliviaBosnia and HerzegovinaBotswanaBrazilBritish Virgin IslandsBrunei DarussalamBulgariaBurkina FasoBurundiCabo VerdeCambodiaCameroonCanadaCaribbean small statesCayman IslandsCentral African RepublicCentral Europe and the BalticsChadChannel IslandsChileChinaColombiaComorosCongo, Dem. Rep.Congo, Rep.Costa RicaCote d'IvoireCroatiaCubaCuracaoCyprusCzech RepublicDenmarkDjiboutiDominicaDominican RepublicEarly-demographic dividendEast Asia & PacificEast Asia & Pacific (excluding high income)East Asia & Pacific (IDA & IBRD countries)EcuadorEgypt, Arab Rep.El SalvadorEquatorial GuineaEritreaEstoniaEthiopiaEuro areaEurope & Central AsiaEurope & Central Asia (excluding high income)Europe & Central Asia (IDA & IBRD countries)European UnionFaroe IslandsFijiFinlandFragile and conflict affected situationsFranceFrench PolynesiaGabonGambia, TheGeorgiaGermanyGhanaGibraltarGreeceGreenlandGrenadaGuamGuatemalaGuineaGuinea-BissauGuyanaHaitiHeavily indebted poor countries (HIPC)High incomeHondurasHong Kong SAR, ChinaHungaryIBRD onlyIcelandIDA & IBRD totalIDA blendIDA onlyIDA totalIndiaIndonesiaIran, Islamic Rep.IraqIrelandIsle of ManIsraelItalyJamaicaJapanJordanKazakhstanKenyaKiribatiKorea, Dem. People’s Rep.Korea, Rep.KuwaitKyrgyz RepublicLao PDRLate-demographic dividendLatin America & Caribbean Latin America & Caribbean (excluding high income)Latin America & the Caribbean (IDA & IBRD countries)LatviaLeast developed countries: UN classificationLebanonLesothoLiberiaLibyaLiechtensteinLithuaniaLow & middle incomeLow incomeLower middle incomeLuxembourgMacao SAR, ChinaMacedonia, FYRMadagascarMalawiMalaysiaMaldivesMaliMaltaMarshall IslandsMauritaniaMauritiusMexicoMicronesia, Fed. Sts.Middle East & North AfricaMiddle East & North Africa (excluding high income)Middle East & North Africa (IDA & IBRD countries)Middle incomeMoldovaMonacoMongoliaMontenegroMoroccoMozambiqueMyanmarNamibiaNauruNepalNetherlandsNew CaledoniaNew ZealandNicaraguaNigerNigeriaNorth AmericaNorthern Mariana IslandsNorwayOECD membersOmanOther small statesPacific island small statesPakistanPalauPanamaPapua New GuineaParaguayPeruPhilippinesPolandPortugalPost-demographic dividendPre-demographic dividendPuerto RicoQatarRomaniaRussian FederationRwandaSamoaSan MarinoSao Tome and PrincipeSaudi ArabiaSenegalSerbiaSeychellesSierra LeoneSingaporeSint Maarten (Dutch part)Slovak RepublicSloveniaSmall statesSolomon IslandsSomaliaSouth AfricaSouth AsiaSouth Asia (IDA & IBRD)South SudanSpainSri LankaSt. Kitts and NevisSt. LuciaSt. Vincent and the GrenadinesSub-Saharan Africa Sub-Saharan Africa (excluding high income)Sub-Saharan Africa (IDA & IBRD countries)SudanSurinameSwazilandSwedenSwitzerlandSyrian Arab RepublicTajikistanTanzaniaThailandTimor-LesteTogoTongaTrinidad and TobagoTunisiaTurkeyTurkmenistanTurks and Caicos IslandsTuvaluUgandaUkraineUnited Arab EmiratesUnited KingdomUnited StatesUpper middle incomeUruguayUzbekistanVanuatuVenezuela, RBVietnamVirgin Islands (U.S.)West Bank and GazaWorldYemen, Rep.ZambiaZimbabwe Timeline:
This timeline shows a graph from 1961 to 2016 of Aruba. No data until 1960. Number of actual observations by date: 56.
Source name:
World Development Indicators
Source organization:
World Bank Staff estimates based on United Nations, World Urbanization Prospects.
Categories, topics:
Agriculture & Rural Development
Last updated:
apr 23, 2017
Indicators value changes by year
Minimum:
49.224
jan 1, 1961
Maximum:
58.472
jan 1, 2016
At the date of observation
Value
Absolute change
Change from previous value
jan 1, 1961
49.224
+49.224
0.0%
jan 1, 1962
49.239
+0.015
0.03%
jan 1, 1963
49.254
+0.015
0.03%
jan 1, 1964
49.27
+0.016
0.03%
jan 1, 1965
49.285
+0.015
0.03%
jan 1, 1966
49.3
+0.015
0.03%
jan 1, 1967
49.315
+0.015
0.03%
jan 1, 1968
49.33
+0.015
0.03%
jan 1, 1969
49.346
+0.016
0.03%
jan 1, 1970
49.361
+0.015
0.03%
jan 1, 1971
49.376
+0.015
0.03%
jan 1, 1972
49.391
+0.015
0.03%
jan 1, 1973
49.407
+0.016
0.03%
jan 1, 1974
49.422
+0.015
0.03%
jan 1, 1975
49.437
+0.015
0.03%
jan 1, 1976
49.452
+0.015
0.03%
jan 1, 1977
49.468
+0.016
0.03%
jan 1, 1978
49.483
+0.015
0.03%
jan 1, 1979
49.498
+0.015
0.03%
jan 1, 1980
49.513
+0.015
0.03%
jan 1, 1981
49.528
+0.015
0.03%
jan 1, 1982
49.544
+0.016
0.03%
jan 1, 1983
49.559
+0.015
0.03%
jan 1, 1984
49.574
+0.015
0.03%
jan 1, 1985
49.589
+0.015
0.03%
jan 1, 1986
49.605
+0.016
0.03%
jan 1, 1987
49.62
+0.015
0.03%
jan 1, 1988
49.635
+0.015
0.03%
jan 1, 1989
49.65
+0.015
0.03%
jan 1, 1990
49.665
+0.015
0.03%
jan 1, 1991
49.681
+0.016
0.03%
jan 1, 1992
49.696
+0.015
0.03%
jan 1, 1993
50.002
+0.306
0.62%
jan 1, 1994
50.412
+0.41
0.82%
jan 1, 1995
50.823
+0.411
0.82%
jan 1, 1996
51.233
+0.41
0.81%
jan 1, 1997
51.644
+0.411
0.8%
jan 1, 1998
52.054
+0.41
0.79%
jan 1, 1999
52.464
+0.41
0.79%
jan 1, 2000
52.873
+0.409
0.78%
jan 1, 2001
53.283
+0.41
0.78%
jan 1, 2002
53.661
+0.378
0.71%
jan 1, 2003
54.028
+0.367
0.68%
jan 1, 2004
54.394
+0.366
0.68%
jan 1, 2005
54.76
+0.366
0.67%
jan 1, 2006
55.125
+0.365
0.67%
jan 1, 2007
55.489
+0.364
0.66%
jan 1, 2008
55.853
+0.364
0.66%
jan 1, 2009
56.217
+0.364
0.65%
jan 1, 2010
56.579
+0.362
0.64%
jan 1, 2011
56.941
+0.362
0.64%
jan 1, 2012
57.302
+0.361
0.63%
jan 1, 2013
57.636
+0.334
0.58%
jan 1, 2014
57.942
+0.306
0.53%
jan 1, 2015
58.221
+0.279
0.48%
jan 1, 2016
58.472
+0.251
0.43%
Ranking of countries by current statistics by years


Comments: