29
/
en
AIzaSyAYiBZKx7MnpbEhh9jyipgxe19OcubqV5w
April 1, 2024
117382
Cyprus
CYP
true
2
1
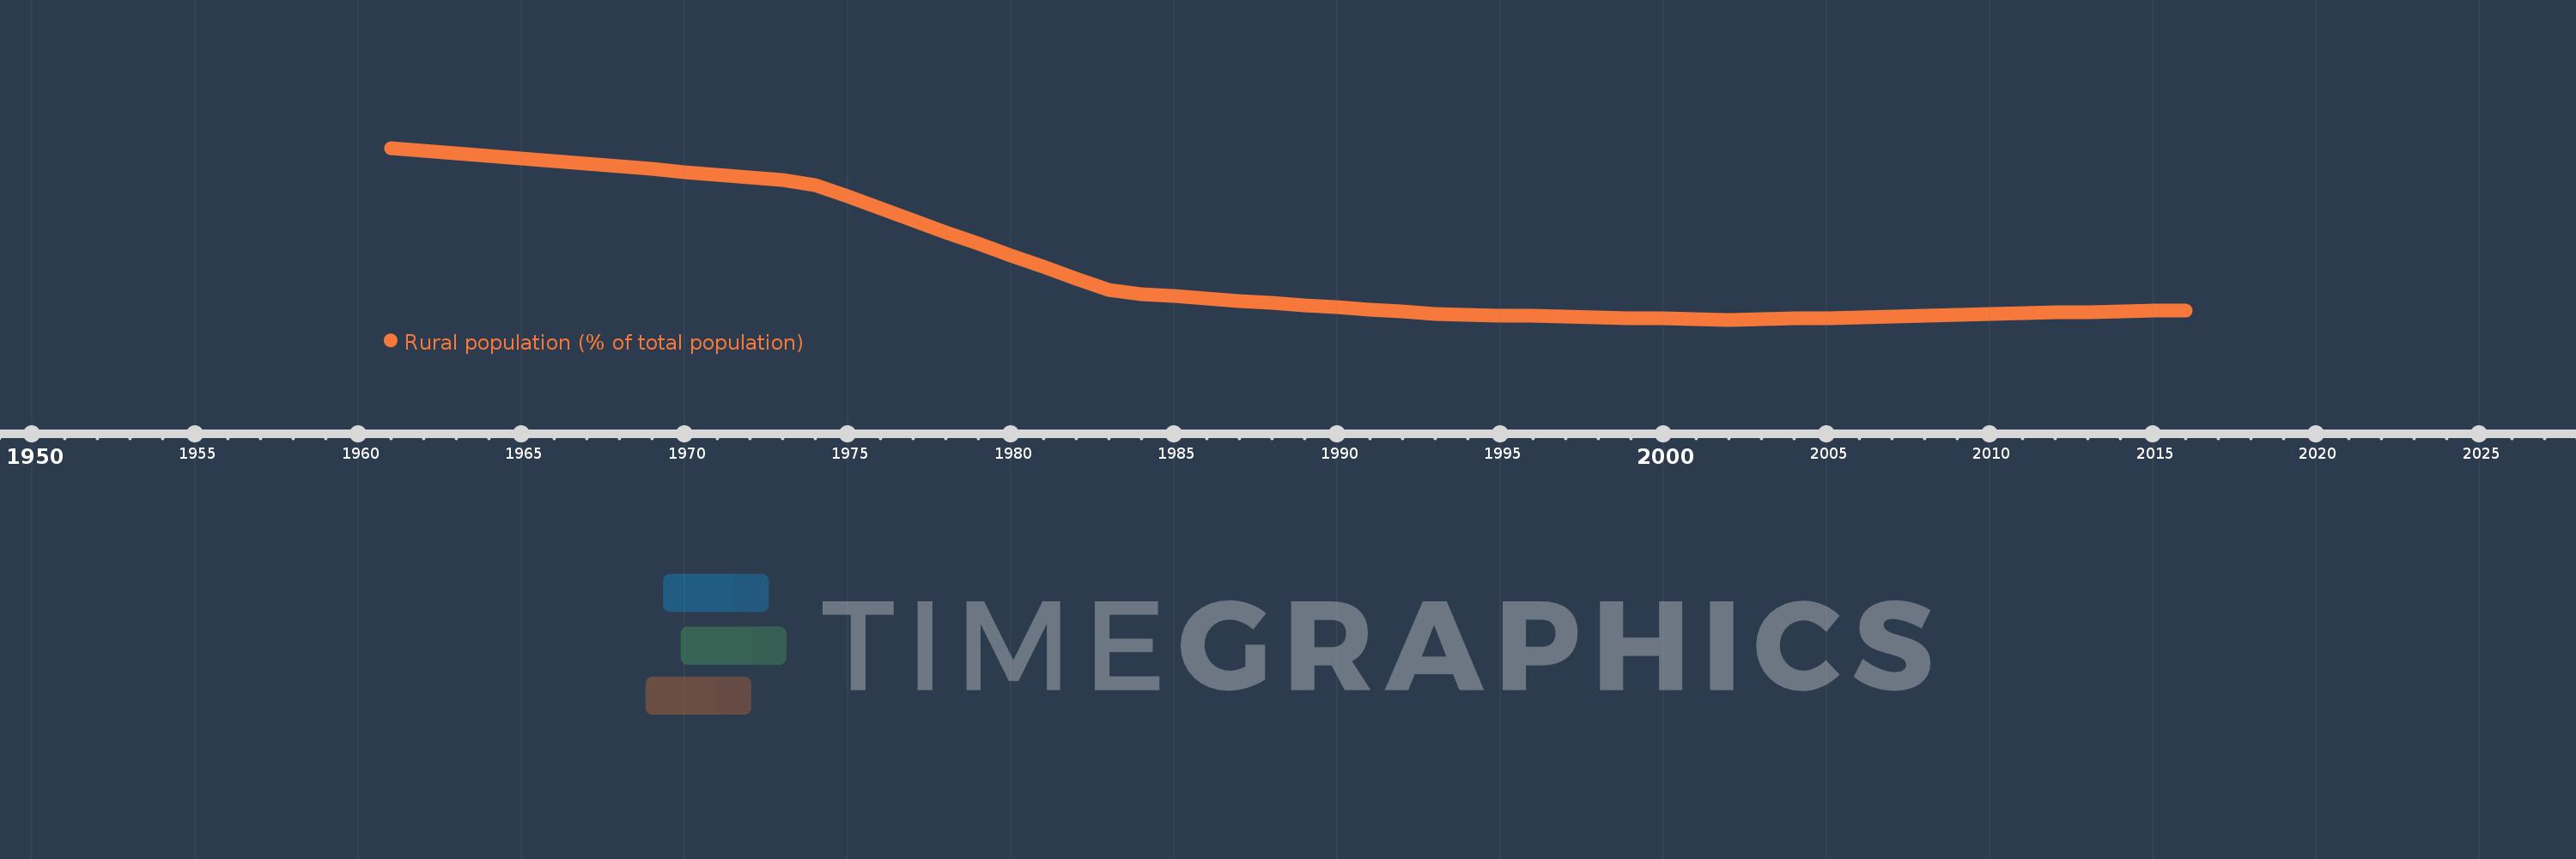
Rural population (% of total population)
2016,2015,2014,2013,2012,2011,2010,2009,2008,2007,2006,2005,2004,2003,2002,2001,2000,1999,1998,1997,1996,1995,1994,1993,1992,1991,1990,1989,1988,1987,1986,1985,1984,1983,1982,1981,1980,1979,1978,1977,1976,1975,1974,1973,1972,1971,1970,1969,1968,1967,1966,1965,1964,1963,1962,1961
This statistics in other country:
AfghanistanAlbaniaAlgeriaAmerican SamoaAndorraAngolaAntigua and BarbudaArab WorldArgentinaArmeniaArubaAustraliaAustriaAzerbaijanBahamas, TheBahrainBangladeshBarbadosBelarusBelgiumBelizeBeninBermudaBhutanBoliviaBosnia and HerzegovinaBotswanaBrazilBritish Virgin IslandsBrunei DarussalamBulgariaBurkina FasoBurundiCabo VerdeCambodiaCameroonCanadaCaribbean small statesCayman IslandsCentral African RepublicCentral Europe and the BalticsChadChannel IslandsChileChinaColombiaComorosCongo, Dem. Rep.Congo, Rep.Costa RicaCote d'IvoireCroatiaCubaCuracaoCyprusCzech RepublicDenmarkDjiboutiDominicaDominican RepublicEarly-demographic dividendEast Asia & PacificEast Asia & Pacific (excluding high income)East Asia & Pacific (IDA & IBRD countries)EcuadorEgypt, Arab Rep.El SalvadorEquatorial GuineaEritreaEstoniaEthiopiaEuro areaEurope & Central AsiaEurope & Central Asia (excluding high income)Europe & Central Asia (IDA & IBRD countries)European UnionFaroe IslandsFijiFinlandFragile and conflict affected situationsFranceFrench PolynesiaGabonGambia, TheGeorgiaGermanyGhanaGibraltarGreeceGreenlandGrenadaGuamGuatemalaGuineaGuinea-BissauGuyanaHaitiHeavily indebted poor countries (HIPC)High incomeHondurasHong Kong SAR, ChinaHungaryIBRD onlyIcelandIDA & IBRD totalIDA blendIDA onlyIDA totalIndiaIndonesiaIran, Islamic Rep.IraqIrelandIsle of ManIsraelItalyJamaicaJapanJordanKazakhstanKenyaKiribatiKorea, Dem. People’s Rep.Korea, Rep.KuwaitKyrgyz RepublicLao PDRLate-demographic dividendLatin America & Caribbean Latin America & Caribbean (excluding high income)Latin America & the Caribbean (IDA & IBRD countries)LatviaLeast developed countries: UN classificationLebanonLesothoLiberiaLibyaLiechtensteinLithuaniaLow & middle incomeLow incomeLower middle incomeLuxembourgMacao SAR, ChinaMacedonia, FYRMadagascarMalawiMalaysiaMaldivesMaliMaltaMarshall IslandsMauritaniaMauritiusMexicoMicronesia, Fed. Sts.Middle East & North AfricaMiddle East & North Africa (excluding high income)Middle East & North Africa (IDA & IBRD countries)Middle incomeMoldovaMonacoMongoliaMontenegroMoroccoMozambiqueMyanmarNamibiaNauruNepalNetherlandsNew CaledoniaNew ZealandNicaraguaNigerNigeriaNorth AmericaNorthern Mariana IslandsNorwayOECD membersOmanOther small statesPacific island small statesPakistanPalauPanamaPapua New GuineaParaguayPeruPhilippinesPolandPortugalPost-demographic dividendPre-demographic dividendPuerto RicoQatarRomaniaRussian FederationRwandaSamoaSan MarinoSao Tome and PrincipeSaudi ArabiaSenegalSerbiaSeychellesSierra LeoneSingaporeSint Maarten (Dutch part)Slovak RepublicSloveniaSmall statesSolomon IslandsSomaliaSouth AfricaSouth AsiaSouth Asia (IDA & IBRD)South SudanSpainSri LankaSt. Kitts and NevisSt. LuciaSt. Vincent and the GrenadinesSub-Saharan Africa Sub-Saharan Africa (excluding high income)Sub-Saharan Africa (IDA & IBRD countries)SudanSurinameSwazilandSwedenSwitzerlandSyrian Arab RepublicTajikistanTanzaniaThailandTimor-LesteTogoTongaTrinidad and TobagoTunisiaTurkeyTurkmenistanTurks and Caicos IslandsTuvaluUgandaUkraineUnited Arab EmiratesUnited KingdomUnited StatesUpper middle incomeUruguayUzbekistanVanuatuVenezuela, RBVietnamVirgin Islands (U.S.)West Bank and GazaWorldYemen, Rep.ZambiaZimbabwe Timeline:
This timeline shows a graph from 1961 to 2016 of Cyprus. No data until 1960. Number of actual observations by date: 56.
Source name:
World Development Indicators
Source organization:
World Bank Staff estimates based on United Nations, World Urbanization Prospects.
Categories, topics:
Agriculture & Rural Development
Last updated:
apr 23, 2017
Indicators value changes by year
Minimum:
31.231
jan 1, 2002
Maximum:
64.372
jan 1, 1961
At the date of observation
Value
Absolute change
Change from previous value
jan 1, 1961
64.372
+64.372
0.0%
jan 1, 1962
63.825
-0.547
-0.85%
jan 1, 1963
63.326
-0.499
-0.78%
jan 1, 1964
62.824
-0.502
-0.79%
jan 1, 1965
62.319
-0.505
-0.8%
jan 1, 1966
61.812
-0.507
-0.81%
jan 1, 1967
61.302
-0.51
-0.83%
jan 1, 1968
60.79
-0.512
-0.84%
jan 1, 1969
60.274
-0.516
-0.85%
jan 1, 1970
59.758
-0.516
-0.86%
jan 1, 1971
59.239
-0.519
-0.87%
jan 1, 1972
58.717
-0.522
-0.88%
jan 1, 1973
58.193
-0.524
-0.89%
jan 1, 1974
57.243
-0.95
-1.63%
jan 1, 1975
54.993
-2.25
-3.93%
jan 1, 1976
52.723
-2.27
-4.13%
jan 1, 1977
50.437
-2.286
-4.34%
jan 1, 1978
48.157
-2.28
-4.52%
jan 1, 1979
45.881
-2.276
-4.73%
jan 1, 1980
43.622
-2.259
-4.92%
jan 1, 1981
41.386
-2.236
-5.13%
jan 1, 1982
39.191
-2.195
-5.3%
jan 1, 1983
37.036
-2.155
-5.5%
jan 1, 1984
36.178
-0.858
-2.32%
jan 1, 1985
35.748
-0.43
-1.19%
jan 1, 1986
35.322
-0.426
-1.19%
jan 1, 1987
34.898
-0.424
-1.2%
jan 1, 1988
34.476
-0.422
-1.21%
jan 1, 1989
34.055
-0.421
-1.22%
jan 1, 1990
33.639
-0.416
-1.22%
jan 1, 1991
33.224
-0.415
-1.23%
jan 1, 1992
32.812
-0.412
-1.24%
jan 1, 1993
32.402
-0.41
-1.25%
jan 1, 1994
32.208
-0.194
-0.6%
jan 1, 1995
32.085
-0.123
-0.38%
jan 1, 1996
31.962
-0.123
-0.38%
jan 1, 1997
31.839
-0.123
-0.38%
jan 1, 1998
31.717
-0.122
-0.38%
jan 1, 1999
31.595
-0.122
-0.38%
jan 1, 2000
31.473
-0.122
-0.39%
jan 1, 2001
31.352
-0.121
-0.38%
jan 1, 2002
31.231
-0.121
-0.39%
jan 1, 2003
31.306
+0.075
0.24%
jan 1, 2004
31.447
+0.141
0.45%
jan 1, 2005
31.59
+0.143
0.45%
jan 1, 2006
31.732
+0.142
0.45%
jan 1, 2007
31.875
+0.143
0.45%
jan 1, 2008
32.018
+0.143
0.45%
jan 1, 2009
32.161
+0.143
0.45%
jan 1, 2010
32.305
+0.144
0.45%
jan 1, 2011
32.449
+0.144
0.45%
jan 1, 2012
32.594
+0.145
0.45%
jan 1, 2013
32.739
+0.145
0.44%
jan 1, 2014
32.867
+0.128
0.39%
jan 1, 2015
32.981
+0.114
0.35%
jan 1, 2016
33.079
+0.098
0.3%
Ranking of countries by current statistics by years


Comments: