29
/
en
AIzaSyAYiBZKx7MnpbEhh9jyipgxe19OcubqV5w
April 1, 2024
178263
Lesotho
LSO
true
2
1
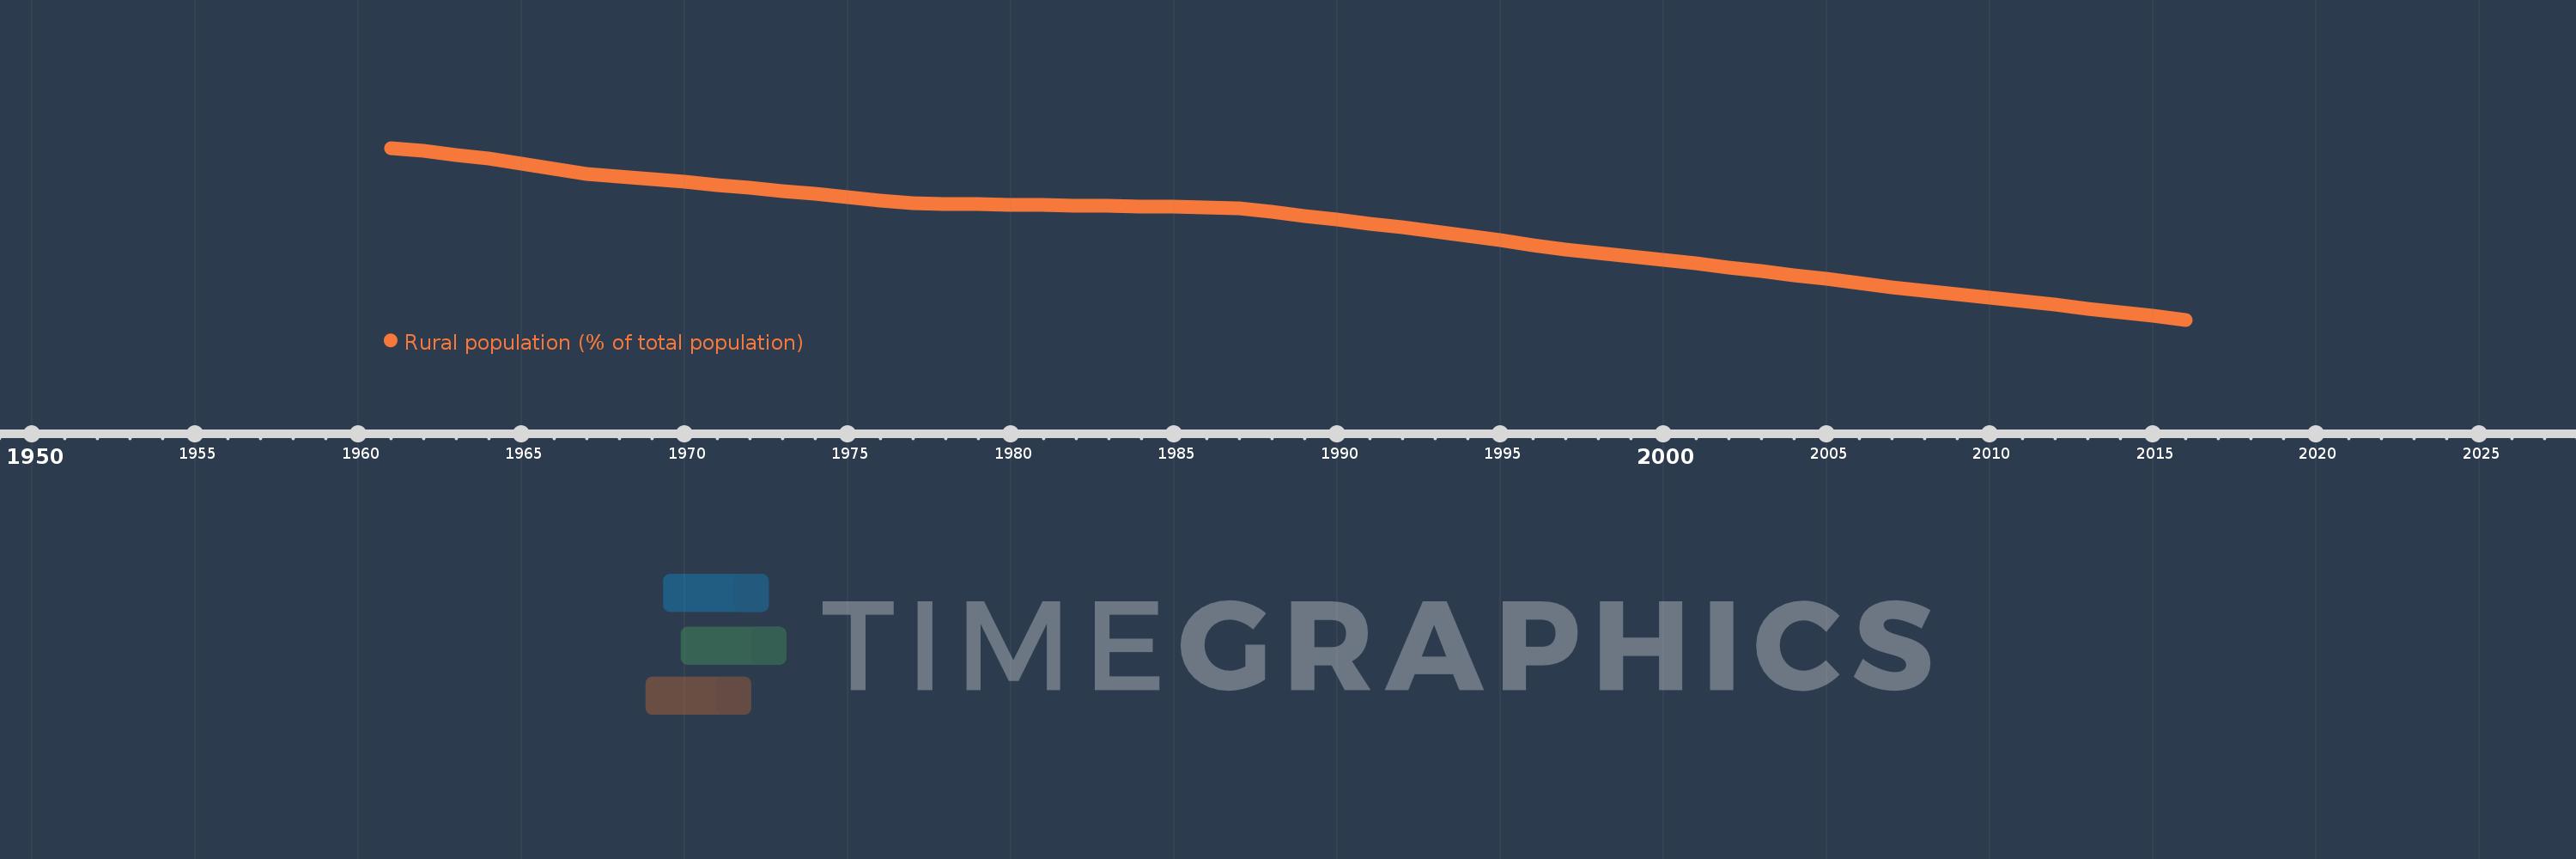
Rural population (% of total population)
2016,2015,2014,2013,2012,2011,2010,2009,2008,2007,2006,2005,2004,2003,2002,2001,2000,1999,1998,1997,1996,1995,1994,1993,1992,1991,1990,1989,1988,1987,1986,1985,1984,1983,1982,1981,1980,1979,1978,1977,1976,1975,1974,1973,1972,1971,1970,1969,1968,1967,1966,1965,1964,1963,1962,1961
This statistics in other country:
AfghanistanAlbaniaAlgeriaAmerican SamoaAndorraAngolaAntigua and BarbudaArab WorldArgentinaArmeniaArubaAustraliaAustriaAzerbaijanBahamas, TheBahrainBangladeshBarbadosBelarusBelgiumBelizeBeninBermudaBhutanBoliviaBosnia and HerzegovinaBotswanaBrazilBritish Virgin IslandsBrunei DarussalamBulgariaBurkina FasoBurundiCabo VerdeCambodiaCameroonCanadaCaribbean small statesCayman IslandsCentral African RepublicCentral Europe and the BalticsChadChannel IslandsChileChinaColombiaComorosCongo, Dem. Rep.Congo, Rep.Costa RicaCote d'IvoireCroatiaCubaCuracaoCyprusCzech RepublicDenmarkDjiboutiDominicaDominican RepublicEarly-demographic dividendEast Asia & PacificEast Asia & Pacific (excluding high income)East Asia & Pacific (IDA & IBRD countries)EcuadorEgypt, Arab Rep.El SalvadorEquatorial GuineaEritreaEstoniaEthiopiaEuro areaEurope & Central AsiaEurope & Central Asia (excluding high income)Europe & Central Asia (IDA & IBRD countries)European UnionFaroe IslandsFijiFinlandFragile and conflict affected situationsFranceFrench PolynesiaGabonGambia, TheGeorgiaGermanyGhanaGibraltarGreeceGreenlandGrenadaGuamGuatemalaGuineaGuinea-BissauGuyanaHaitiHeavily indebted poor countries (HIPC)High incomeHondurasHong Kong SAR, ChinaHungaryIBRD onlyIcelandIDA & IBRD totalIDA blendIDA onlyIDA totalIndiaIndonesiaIran, Islamic Rep.IraqIrelandIsle of ManIsraelItalyJamaicaJapanJordanKazakhstanKenyaKiribatiKorea, Dem. People’s Rep.Korea, Rep.KuwaitKyrgyz RepublicLao PDRLate-demographic dividendLatin America & Caribbean Latin America & Caribbean (excluding high income)Latin America & the Caribbean (IDA & IBRD countries)LatviaLeast developed countries: UN classificationLebanonLesothoLiberiaLibyaLiechtensteinLithuaniaLow & middle incomeLow incomeLower middle incomeLuxembourgMacao SAR, ChinaMacedonia, FYRMadagascarMalawiMalaysiaMaldivesMaliMaltaMarshall IslandsMauritaniaMauritiusMexicoMicronesia, Fed. Sts.Middle East & North AfricaMiddle East & North Africa (excluding high income)Middle East & North Africa (IDA & IBRD countries)Middle incomeMoldovaMonacoMongoliaMontenegroMoroccoMozambiqueMyanmarNamibiaNauruNepalNetherlandsNew CaledoniaNew ZealandNicaraguaNigerNigeriaNorth AmericaNorthern Mariana IslandsNorwayOECD membersOmanOther small statesPacific island small statesPakistanPalauPanamaPapua New GuineaParaguayPeruPhilippinesPolandPortugalPost-demographic dividendPre-demographic dividendPuerto RicoQatarRomaniaRussian FederationRwandaSamoaSan MarinoSao Tome and PrincipeSaudi ArabiaSenegalSerbiaSeychellesSierra LeoneSingaporeSint Maarten (Dutch part)Slovak RepublicSloveniaSmall statesSolomon IslandsSomaliaSouth AfricaSouth AsiaSouth Asia (IDA & IBRD)South SudanSpainSri LankaSt. Kitts and NevisSt. LuciaSt. Vincent and the GrenadinesSub-Saharan Africa Sub-Saharan Africa (excluding high income)Sub-Saharan Africa (IDA & IBRD countries)SudanSurinameSwazilandSwedenSwitzerlandSyrian Arab RepublicTajikistanTanzaniaThailandTimor-LesteTogoTongaTrinidad and TobagoTunisiaTurkeyTurkmenistanTurks and Caicos IslandsTuvaluUgandaUkraineUnited Arab EmiratesUnited KingdomUnited StatesUpper middle incomeUruguayUzbekistanVanuatuVenezuela, RBVietnamVirgin Islands (U.S.)West Bank and GazaWorldYemen, Rep.ZambiaZimbabwe Timeline:
This timeline shows a graph from 1961 to 2016 of Lesotho. No data until 1960. Number of actual observations by date: 56.
Source name:
World Development Indicators
Source organization:
World Bank Staff estimates based on United Nations, World Urbanization Prospects.
Categories, topics:
Agriculture & Rural Development
Last updated:
apr 23, 2017
Indicators value changes by year
Minimum:
72.688
jan 1, 2016
Maximum:
96.488
jan 1, 1961
At the date of observation
Value
Absolute change
Change from previous value
jan 1, 1961
96.488
+96.488
0.0%
jan 1, 1962
96.04
-0.448
-0.46%
jan 1, 1963
95.536
-0.504
-0.52%
jan 1, 1964
94.971
-0.565
-0.59%
jan 1, 1965
94.339
-0.632
-0.67%
jan 1, 1966
93.634
-0.705
-0.75%
jan 1, 1967
92.935
-0.699
-0.75%
jan 1, 1968
92.575
-0.36
-0.39%
jan 1, 1969
92.198
-0.377
-0.41%
jan 1, 1970
91.804
-0.394
-0.43%
jan 1, 1971
91.392
-0.412
-0.45%
jan 1, 1972
90.961
-0.431
-0.47%
jan 1, 1973
90.526
-0.435
-0.48%
jan 1, 1974
90.095
-0.431
-0.48%
jan 1, 1975
89.645
-0.45
-0.5%
jan 1, 1976
89.178
-0.467
-0.52%
jan 1, 1977
88.787
-0.391
-0.44%
jan 1, 1978
88.728
-0.059
-0.07%
jan 1, 1979
88.669
-0.059
-0.07%
jan 1, 1980
88.61
-0.059
-0.07%
jan 1, 1981
88.55
-0.06
-0.07%
jan 1, 1982
88.49
-0.06
-0.07%
jan 1, 1983
88.43
-0.06
-0.07%
jan 1, 1984
88.37
-0.06
-0.07%
jan 1, 1985
88.309
-0.061
-0.07%
jan 1, 1986
88.248
-0.061
-0.07%
jan 1, 1987
88.095
-0.153
-0.17%
jan 1, 1988
87.606
-0.489
-0.56%
jan 1, 1989
87.099
-0.507
-0.58%
jan 1, 1990
86.575
-0.524
-0.6%
jan 1, 1991
86.033
-0.542
-0.63%
jan 1, 1992
85.473
-0.56
-0.65%
jan 1, 1993
84.894
-0.579
-0.68%
jan 1, 1994
84.297
-0.597
-0.7%
jan 1, 1995
83.681
-0.616
-0.73%
jan 1, 1996
83.045
-0.636
-0.76%
jan 1, 1997
82.429
-0.616
-0.74%
jan 1, 1998
81.951
-0.478
-0.58%
jan 1, 1999
81.462
-0.489
-0.6%
jan 1, 2000
80.962
-0.5
-0.61%
jan 1, 2001
80.452
-0.51
-0.63%
jan 1, 2002
79.933
-0.519
-0.65%
jan 1, 2003
79.403
-0.53
-0.66%
jan 1, 2004
78.863
-0.54
-0.68%
jan 1, 2005
78.311
-0.552
-0.7%
jan 1, 2006
77.751
-0.56
-0.72%
jan 1, 2007
77.18
-0.571
-0.73%
jan 1, 2008
76.707
-0.473
-0.61%
jan 1, 2009
76.226
-0.481
-0.63%
jan 1, 2010
75.741
-0.485
-0.64%
jan 1, 2011
75.247
-0.494
-0.65%
jan 1, 2012
74.747
-0.5
-0.66%
jan 1, 2013
74.24
-0.507
-0.68%
jan 1, 2014
73.729
-0.511
-0.69%
jan 1, 2015
73.211
-0.518
-0.7%
jan 1, 2016
72.688
-0.523
-0.71%
Ranking of countries by current statistics by years


Comments: