29
/
en
AIzaSyAYiBZKx7MnpbEhh9jyipgxe19OcubqV5w
April 1, 2024
251356
St. Lucia
LCA
true
2
1
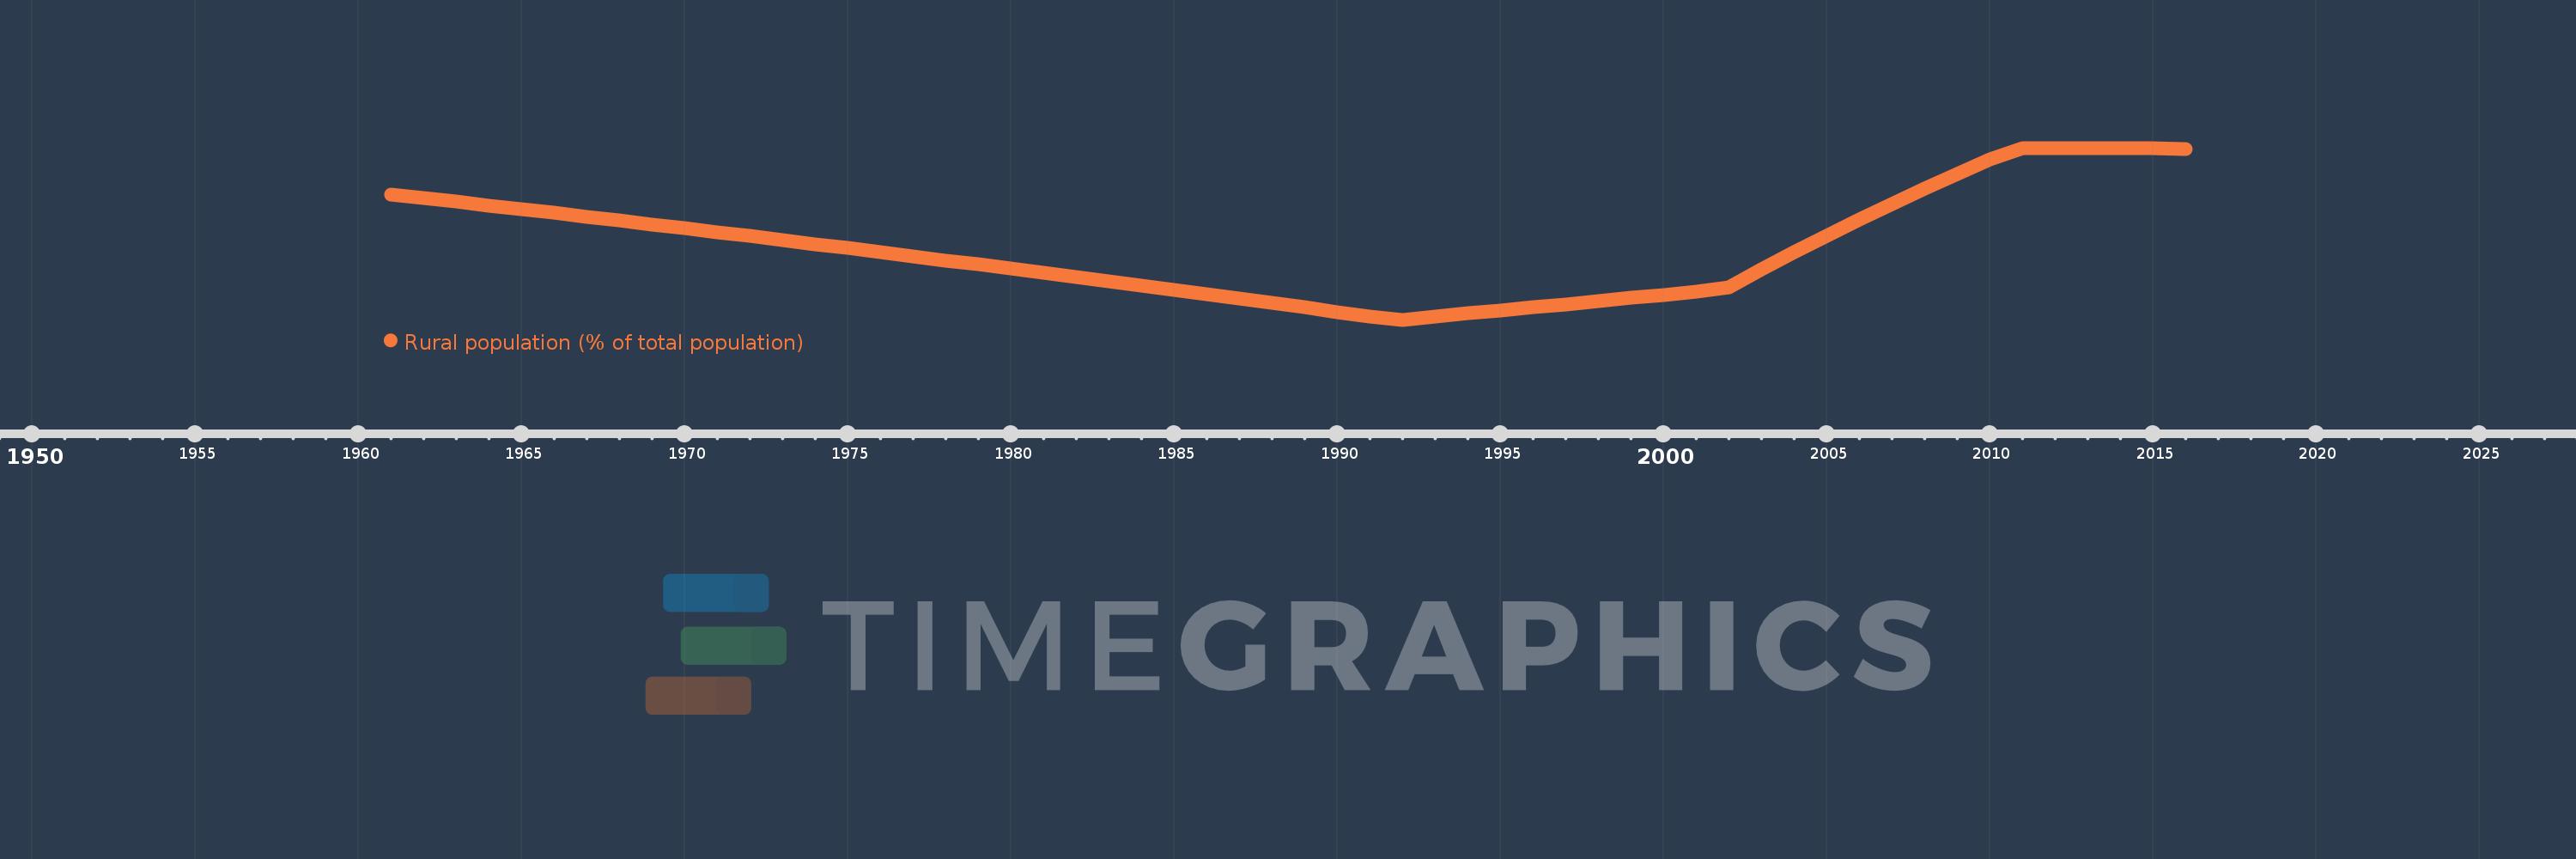
Rural population (% of total population)
2016,2015,2014,2013,2012,2011,2010,2009,2008,2007,2006,2005,2004,2003,2002,2001,2000,1999,1998,1997,1996,1995,1994,1993,1992,1991,1990,1989,1988,1987,1986,1985,1984,1983,1982,1981,1980,1979,1978,1977,1976,1975,1974,1973,1972,1971,1970,1969,1968,1967,1966,1965,1964,1963,1962,1961
This statistics in other country:
AfghanistanAlbaniaAlgeriaAmerican SamoaAndorraAngolaAntigua and BarbudaArab WorldArgentinaArmeniaArubaAustraliaAustriaAzerbaijanBahamas, TheBahrainBangladeshBarbadosBelarusBelgiumBelizeBeninBermudaBhutanBoliviaBosnia and HerzegovinaBotswanaBrazilBritish Virgin IslandsBrunei DarussalamBulgariaBurkina FasoBurundiCabo VerdeCambodiaCameroonCanadaCaribbean small statesCayman IslandsCentral African RepublicCentral Europe and the BalticsChadChannel IslandsChileChinaColombiaComorosCongo, Dem. Rep.Congo, Rep.Costa RicaCote d'IvoireCroatiaCubaCuracaoCyprusCzech RepublicDenmarkDjiboutiDominicaDominican RepublicEarly-demographic dividendEast Asia & PacificEast Asia & Pacific (excluding high income)East Asia & Pacific (IDA & IBRD countries)EcuadorEgypt, Arab Rep.El SalvadorEquatorial GuineaEritreaEstoniaEthiopiaEuro areaEurope & Central AsiaEurope & Central Asia (excluding high income)Europe & Central Asia (IDA & IBRD countries)European UnionFaroe IslandsFijiFinlandFragile and conflict affected situationsFranceFrench PolynesiaGabonGambia, TheGeorgiaGermanyGhanaGibraltarGreeceGreenlandGrenadaGuamGuatemalaGuineaGuinea-BissauGuyanaHaitiHeavily indebted poor countries (HIPC)High incomeHondurasHong Kong SAR, ChinaHungaryIBRD onlyIcelandIDA & IBRD totalIDA blendIDA onlyIDA totalIndiaIndonesiaIran, Islamic Rep.IraqIrelandIsle of ManIsraelItalyJamaicaJapanJordanKazakhstanKenyaKiribatiKorea, Dem. People’s Rep.Korea, Rep.KuwaitKyrgyz RepublicLao PDRLate-demographic dividendLatin America & Caribbean Latin America & Caribbean (excluding high income)Latin America & the Caribbean (IDA & IBRD countries)LatviaLeast developed countries: UN classificationLebanonLesothoLiberiaLibyaLiechtensteinLithuaniaLow & middle incomeLow incomeLower middle incomeLuxembourgMacao SAR, ChinaMacedonia, FYRMadagascarMalawiMalaysiaMaldivesMaliMaltaMarshall IslandsMauritaniaMauritiusMexicoMicronesia, Fed. Sts.Middle East & North AfricaMiddle East & North Africa (excluding high income)Middle East & North Africa (IDA & IBRD countries)Middle incomeMoldovaMonacoMongoliaMontenegroMoroccoMozambiqueMyanmarNamibiaNauruNepalNetherlandsNew CaledoniaNew ZealandNicaraguaNigerNigeriaNorth AmericaNorthern Mariana IslandsNorwayOECD membersOmanOther small statesPacific island small statesPakistanPalauPanamaPapua New GuineaParaguayPeruPhilippinesPolandPortugalPost-demographic dividendPre-demographic dividendPuerto RicoQatarRomaniaRussian FederationRwandaSamoaSan MarinoSao Tome and PrincipeSaudi ArabiaSenegalSerbiaSeychellesSierra LeoneSingaporeSint Maarten (Dutch part)Slovak RepublicSloveniaSmall statesSolomon IslandsSomaliaSouth AfricaSouth AsiaSouth Asia (IDA & IBRD)South SudanSpainSri LankaSt. Kitts and NevisSt. LuciaSt. Vincent and the GrenadinesSub-Saharan Africa Sub-Saharan Africa (excluding high income)Sub-Saharan Africa (IDA & IBRD countries)SudanSurinameSwazilandSwedenSwitzerlandSyrian Arab RepublicTajikistanTanzaniaThailandTimor-LesteTogoTongaTrinidad and TobagoTunisiaTurkeyTurkmenistanTurks and Caicos IslandsTuvaluUgandaUkraineUnited Arab EmiratesUnited KingdomUnited StatesUpper middle incomeUruguayUzbekistanVanuatuVenezuela, RBVietnamVirgin Islands (U.S.)West Bank and GazaWorldYemen, Rep.ZambiaZimbabwe Timeline:
This timeline shows a graph from 1961 to 2016 of St. Lucia. No data until 1960. Number of actual observations by date: 56.
Source name:
World Development Indicators
Source organization:
World Bank Staff estimates based on United Nations, World Urbanization Prospects.
Categories, topics:
Agriculture & Rural Development
Last updated:
apr 23, 2017
Indicators value changes by year
Minimum:
70.428
jan 1, 1992
At the date of observation
Value
Absolute change
Change from previous value
jan 1, 1961
78.54
+78.54
0.0%
jan 1, 1962
78.304
-0.236
-0.3%
jan 1, 1963
78.066
-0.238
-0.3%
jan 1, 1964
77.826
-0.24
-0.31%
jan 1, 1965
77.584
-0.242
-0.31%
jan 1, 1966
77.34
-0.244
-0.31%
jan 1, 1967
77.095
-0.245
-0.32%
jan 1, 1968
76.847
-0.248
-0.32%
jan 1, 1969
76.597
-0.25
-0.33%
jan 1, 1970
76.346
-0.251
-0.33%
jan 1, 1971
76.093
-0.253
-0.33%
jan 1, 1972
75.838
-0.255
-0.34%
jan 1, 1973
75.581
-0.257
-0.34%
jan 1, 1974
75.323
-0.258
-0.34%
jan 1, 1975
75.062
-0.261
-0.35%
jan 1, 1976
74.8
-0.262
-0.35%
jan 1, 1977
74.535
-0.265
-0.35%
jan 1, 1978
74.27
-0.265
-0.36%
jan 1, 1979
74.002
-0.268
-0.36%
jan 1, 1980
73.732
-0.27
-0.36%
jan 1, 1981
73.46
-0.272
-0.37%
jan 1, 1982
73.188
-0.272
-0.37%
jan 1, 1983
72.913
-0.275
-0.38%
jan 1, 1984
72.636
-0.277
-0.38%
jan 1, 1985
72.357
-0.279
-0.38%
jan 1, 1986
72.077
-0.28
-0.39%
jan 1, 1987
71.795
-0.282
-0.39%
jan 1, 1988
71.512
-0.283
-0.39%
jan 1, 1989
71.226
-0.286
-0.4%
jan 1, 1990
70.939
-0.287
-0.4%
jan 1, 1991
70.651
-0.288
-0.41%
jan 1, 1992
70.428
-0.223
-0.32%
jan 1, 1993
70.631
+0.203
0.29%
jan 1, 1994
70.833
+0.202
0.29%
jan 1, 1995
71.035
+0.202
0.29%
jan 1, 1996
71.235
+0.2
0.28%
jan 1, 1997
71.435
+0.2
0.28%
jan 1, 1998
71.634
+0.199
0.28%
jan 1, 1999
71.832
+0.198
0.28%
jan 1, 2000
72.029
+0.197
0.27%
jan 1, 2001
72.226
+0.197
0.27%
jan 1, 2002
72.527
+0.301
0.42%
jan 1, 2003
73.671
+1.144
1.58%
jan 1, 2004
74.784
+1.113
1.51%
jan 1, 2005
75.867
+1.083
1.45%
jan 1, 2006
76.915
+1.048
1.38%
jan 1, 2007
77.932
+1.017
1.32%
jan 1, 2008
78.916
+0.984
1.26%
jan 1, 2009
79.869
+0.953
1.21%
jan 1, 2010
80.787
+0.918
1.15%
jan 1, 2011
81.55
+0.763
0.94%
jan 1, 2012
81.55
0.0
0.0%
jan 1, 2013
81.55
0.0
0.0%
jan 1, 2014
81.541
-0.009
-0.01%
jan 1, 2015
81.523
-0.018
-0.02%
jan 1, 2016
81.496
-0.027
-0.03%
Ranking of countries by current statistics by years


Comments: