29
/
en
AIzaSyAYiBZKx7MnpbEhh9jyipgxe19OcubqV5w
April 1, 2024
74356
Austria
AUT
true
2
1
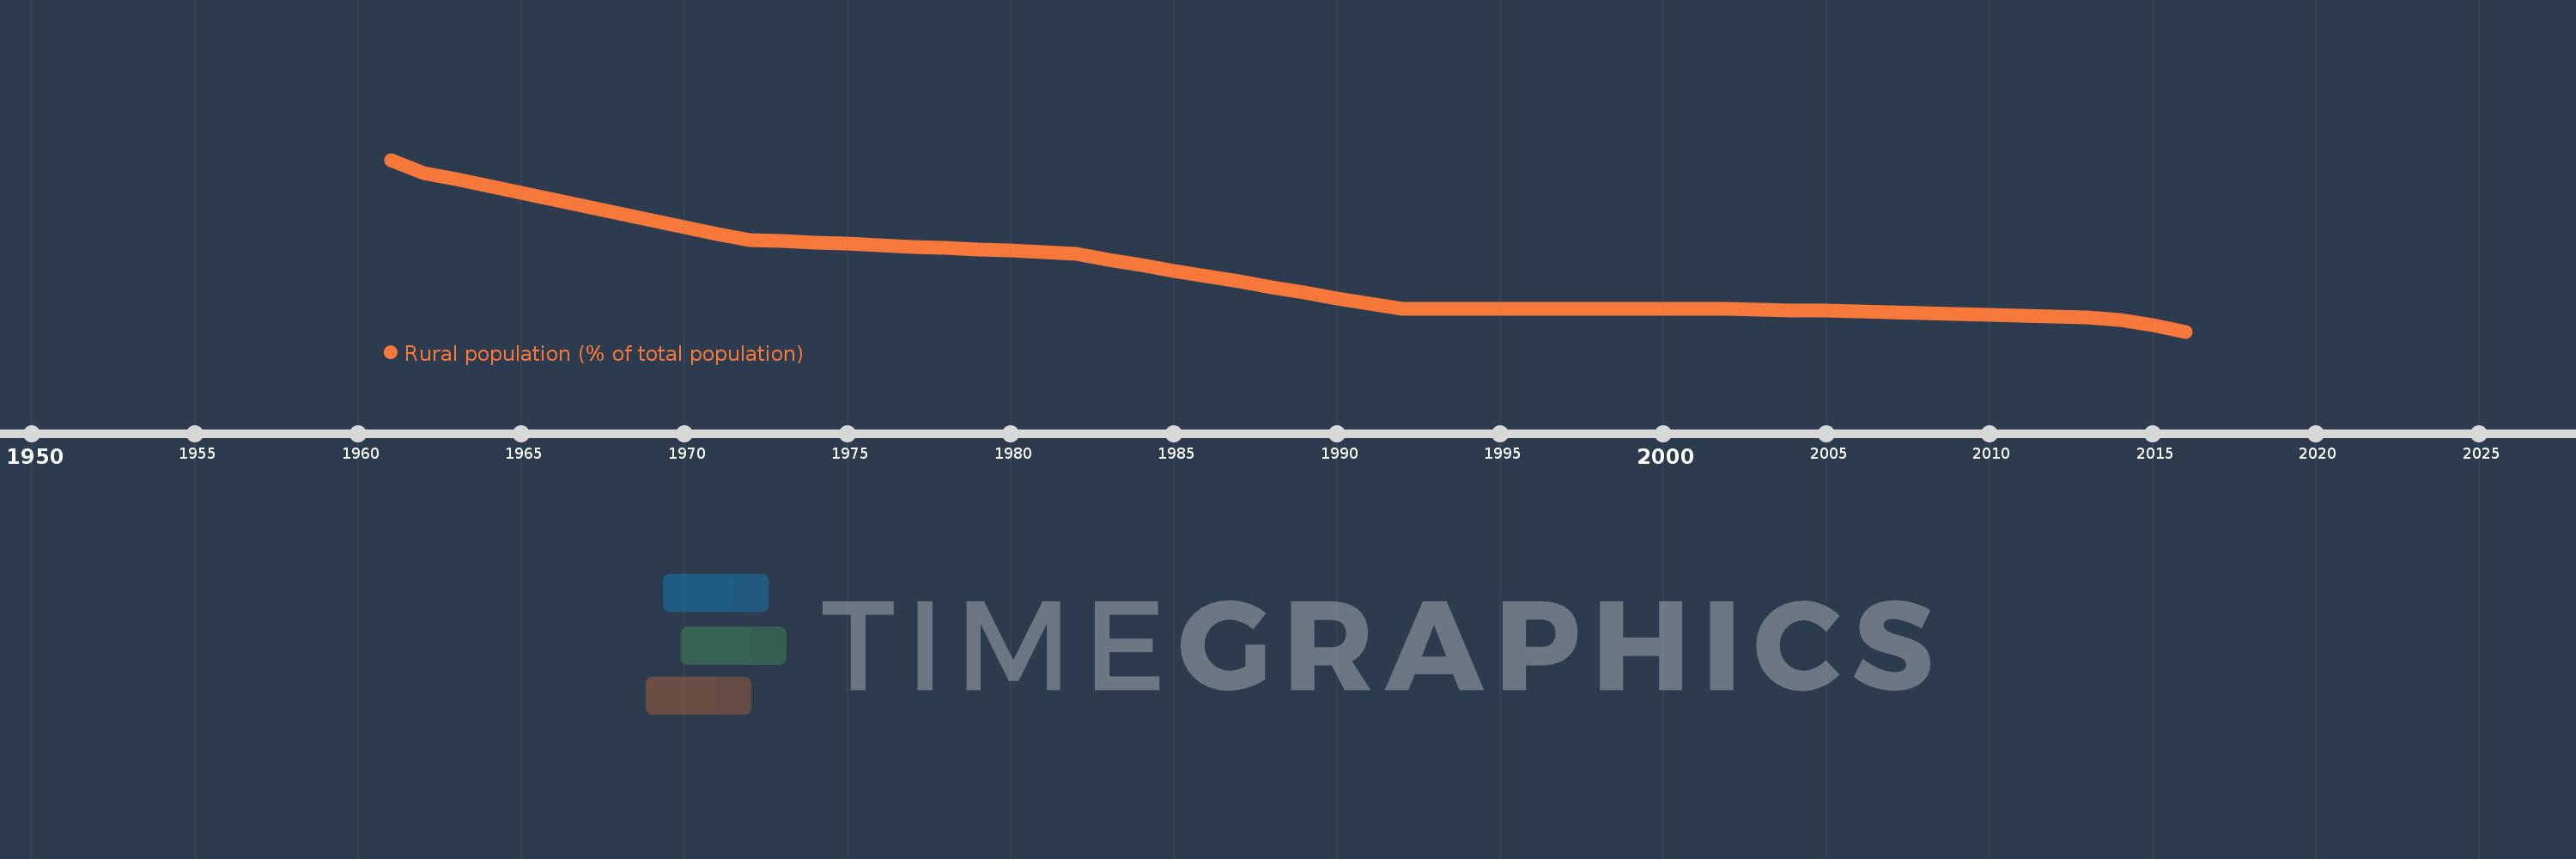
Rural population (% of total population)
2016,2015,2014,2013,2012,2011,2010,2009,2008,2007,2006,2005,2004,2003,2002,2001,2000,1999,1998,1997,1996,1995,1994,1993,1992,1991,1990,1989,1988,1987,1986,1985,1984,1983,1982,1981,1980,1979,1978,1977,1976,1975,1974,1973,1972,1971,1970,1969,1968,1967,1966,1965,1964,1963,1962,1961
This statistics in other country:
AfghanistanAlbaniaAlgeriaAmerican SamoaAndorraAngolaAntigua and BarbudaArab WorldArgentinaArmeniaArubaAustraliaAustriaAzerbaijanBahamas, TheBahrainBangladeshBarbadosBelarusBelgiumBelizeBeninBermudaBhutanBoliviaBosnia and HerzegovinaBotswanaBrazilBritish Virgin IslandsBrunei DarussalamBulgariaBurkina FasoBurundiCabo VerdeCambodiaCameroonCanadaCaribbean small statesCayman IslandsCentral African RepublicCentral Europe and the BalticsChadChannel IslandsChileChinaColombiaComorosCongo, Dem. Rep.Congo, Rep.Costa RicaCote d'IvoireCroatiaCubaCuracaoCyprusCzech RepublicDenmarkDjiboutiDominicaDominican RepublicEarly-demographic dividendEast Asia & PacificEast Asia & Pacific (excluding high income)East Asia & Pacific (IDA & IBRD countries)EcuadorEgypt, Arab Rep.El SalvadorEquatorial GuineaEritreaEstoniaEthiopiaEuro areaEurope & Central AsiaEurope & Central Asia (excluding high income)Europe & Central Asia (IDA & IBRD countries)European UnionFaroe IslandsFijiFinlandFragile and conflict affected situationsFranceFrench PolynesiaGabonGambia, TheGeorgiaGermanyGhanaGibraltarGreeceGreenlandGrenadaGuamGuatemalaGuineaGuinea-BissauGuyanaHaitiHeavily indebted poor countries (HIPC)High incomeHondurasHong Kong SAR, ChinaHungaryIBRD onlyIcelandIDA & IBRD totalIDA blendIDA onlyIDA totalIndiaIndonesiaIran, Islamic Rep.IraqIrelandIsle of ManIsraelItalyJamaicaJapanJordanKazakhstanKenyaKiribatiKorea, Dem. People’s Rep.Korea, Rep.KuwaitKyrgyz RepublicLao PDRLate-demographic dividendLatin America & Caribbean Latin America & Caribbean (excluding high income)Latin America & the Caribbean (IDA & IBRD countries)LatviaLeast developed countries: UN classificationLebanonLesothoLiberiaLibyaLiechtensteinLithuaniaLow & middle incomeLow incomeLower middle incomeLuxembourgMacao SAR, ChinaMacedonia, FYRMadagascarMalawiMalaysiaMaldivesMaliMaltaMarshall IslandsMauritaniaMauritiusMexicoMicronesia, Fed. Sts.Middle East & North AfricaMiddle East & North Africa (excluding high income)Middle East & North Africa (IDA & IBRD countries)Middle incomeMoldovaMonacoMongoliaMontenegroMoroccoMozambiqueMyanmarNamibiaNauruNepalNetherlandsNew CaledoniaNew ZealandNicaraguaNigerNigeriaNorth AmericaNorthern Mariana IslandsNorwayOECD membersOmanOther small statesPacific island small statesPakistanPalauPanamaPapua New GuineaParaguayPeruPhilippinesPolandPortugalPost-demographic dividendPre-demographic dividendPuerto RicoQatarRomaniaRussian FederationRwandaSamoaSan MarinoSao Tome and PrincipeSaudi ArabiaSenegalSerbiaSeychellesSierra LeoneSingaporeSint Maarten (Dutch part)Slovak RepublicSloveniaSmall statesSolomon IslandsSomaliaSouth AfricaSouth AsiaSouth Asia (IDA & IBRD)South SudanSpainSri LankaSt. Kitts and NevisSt. LuciaSt. Vincent and the GrenadinesSub-Saharan Africa Sub-Saharan Africa (excluding high income)Sub-Saharan Africa (IDA & IBRD countries)SudanSurinameSwazilandSwedenSwitzerlandSyrian Arab RepublicTajikistanTanzaniaThailandTimor-LesteTogoTongaTrinidad and TobagoTunisiaTurkeyTurkmenistanTurks and Caicos IslandsTuvaluUgandaUkraineUnited Arab EmiratesUnited KingdomUnited StatesUpper middle incomeUruguayUzbekistanVanuatuVenezuela, RBVietnamVirgin Islands (U.S.)West Bank and GazaWorldYemen, Rep.ZambiaZimbabwe Timeline:
This timeline shows a graph from 1961 to 2016 of Austria. No data until 1960. Number of actual observations by date: 56.
Source name:
World Development Indicators
Source organization:
World Bank Staff estimates based on United Nations, World Urbanization Prospects.
Categories, topics:
Agriculture & Rural Development
Last updated:
apr 23, 2017
Indicators value changes by year
Minimum:
34.032
jan 1, 2016
At the date of observation
Value
Absolute change
Change from previous value
jan 1, 1961
35.28
+35.28
0.0%
jan 1, 1962
35.186
-0.094
-0.27%
jan 1, 1963
35.137
-0.049
-0.14%
jan 1, 1964
35.087
-0.05
-0.14%
jan 1, 1965
35.038
-0.049
-0.14%
jan 1, 1966
34.989
-0.049
-0.14%
jan 1, 1967
34.939
-0.05
-0.14%
jan 1, 1968
34.89
-0.049
-0.14%
jan 1, 1969
34.841
-0.049
-0.14%
jan 1, 1970
34.792
-0.049
-0.14%
jan 1, 1971
34.742
-0.05
-0.14%
jan 1, 1972
34.699
-0.043
-0.12%
jan 1, 1973
34.689
-0.01
-0.03%
jan 1, 1974
34.679
-0.01
-0.03%
jan 1, 1975
34.669
-0.01
-0.03%
jan 1, 1976
34.659
-0.01
-0.03%
jan 1, 1977
34.649
-0.01
-0.03%
jan 1, 1978
34.639
-0.01
-0.03%
jan 1, 1979
34.629
-0.01
-0.03%
jan 1, 1980
34.619
-0.01
-0.03%
jan 1, 1981
34.609
-0.01
-0.03%
jan 1, 1982
34.595
-0.014
-0.04%
jan 1, 1983
34.554
-0.041
-0.12%
jan 1, 1984
34.514
-0.04
-0.12%
jan 1, 1985
34.474
-0.04
-0.12%
jan 1, 1986
34.434
-0.04
-0.12%
jan 1, 1987
34.394
-0.04
-0.12%
jan 1, 1988
34.354
-0.04
-0.12%
jan 1, 1989
34.314
-0.04
-0.12%
jan 1, 1990
34.275
-0.039
-0.11%
jan 1, 1991
34.235
-0.04
-0.12%
jan 1, 1992
34.2
-0.035
-0.1%
jan 1, 2002
34.199
-0.001
0.0%
jan 1, 2003
34.194
-0.005
-0.01%
jan 1, 2004
34.188
-0.006
-0.02%
jan 1, 2005
34.182
-0.006
-0.02%
jan 1, 2006
34.176
-0.006
-0.02%
jan 1, 2007
34.171
-0.005
-0.01%
jan 1, 2008
34.165
-0.006
-0.02%
jan 1, 2009
34.159
-0.006
-0.02%
jan 1, 2010
34.153
-0.006
-0.02%
jan 1, 2011
34.148
-0.005
-0.01%
jan 1, 2012
34.142
-0.006
-0.02%
jan 1, 2013
34.136
-0.006
-0.02%
jan 1, 2014
34.116
-0.02
-0.06%
jan 1, 2015
34.081
-0.035
-0.1%
jan 1, 2016
34.032
-0.049
-0.14%
Ranking of countries by current statistics by years


Comments: