29
/
en
AIzaSyAYiBZKx7MnpbEhh9jyipgxe19OcubqV5w
April 1, 2024
28676
East Asia & Pacific (excluding high income)
EAP
false
2
1
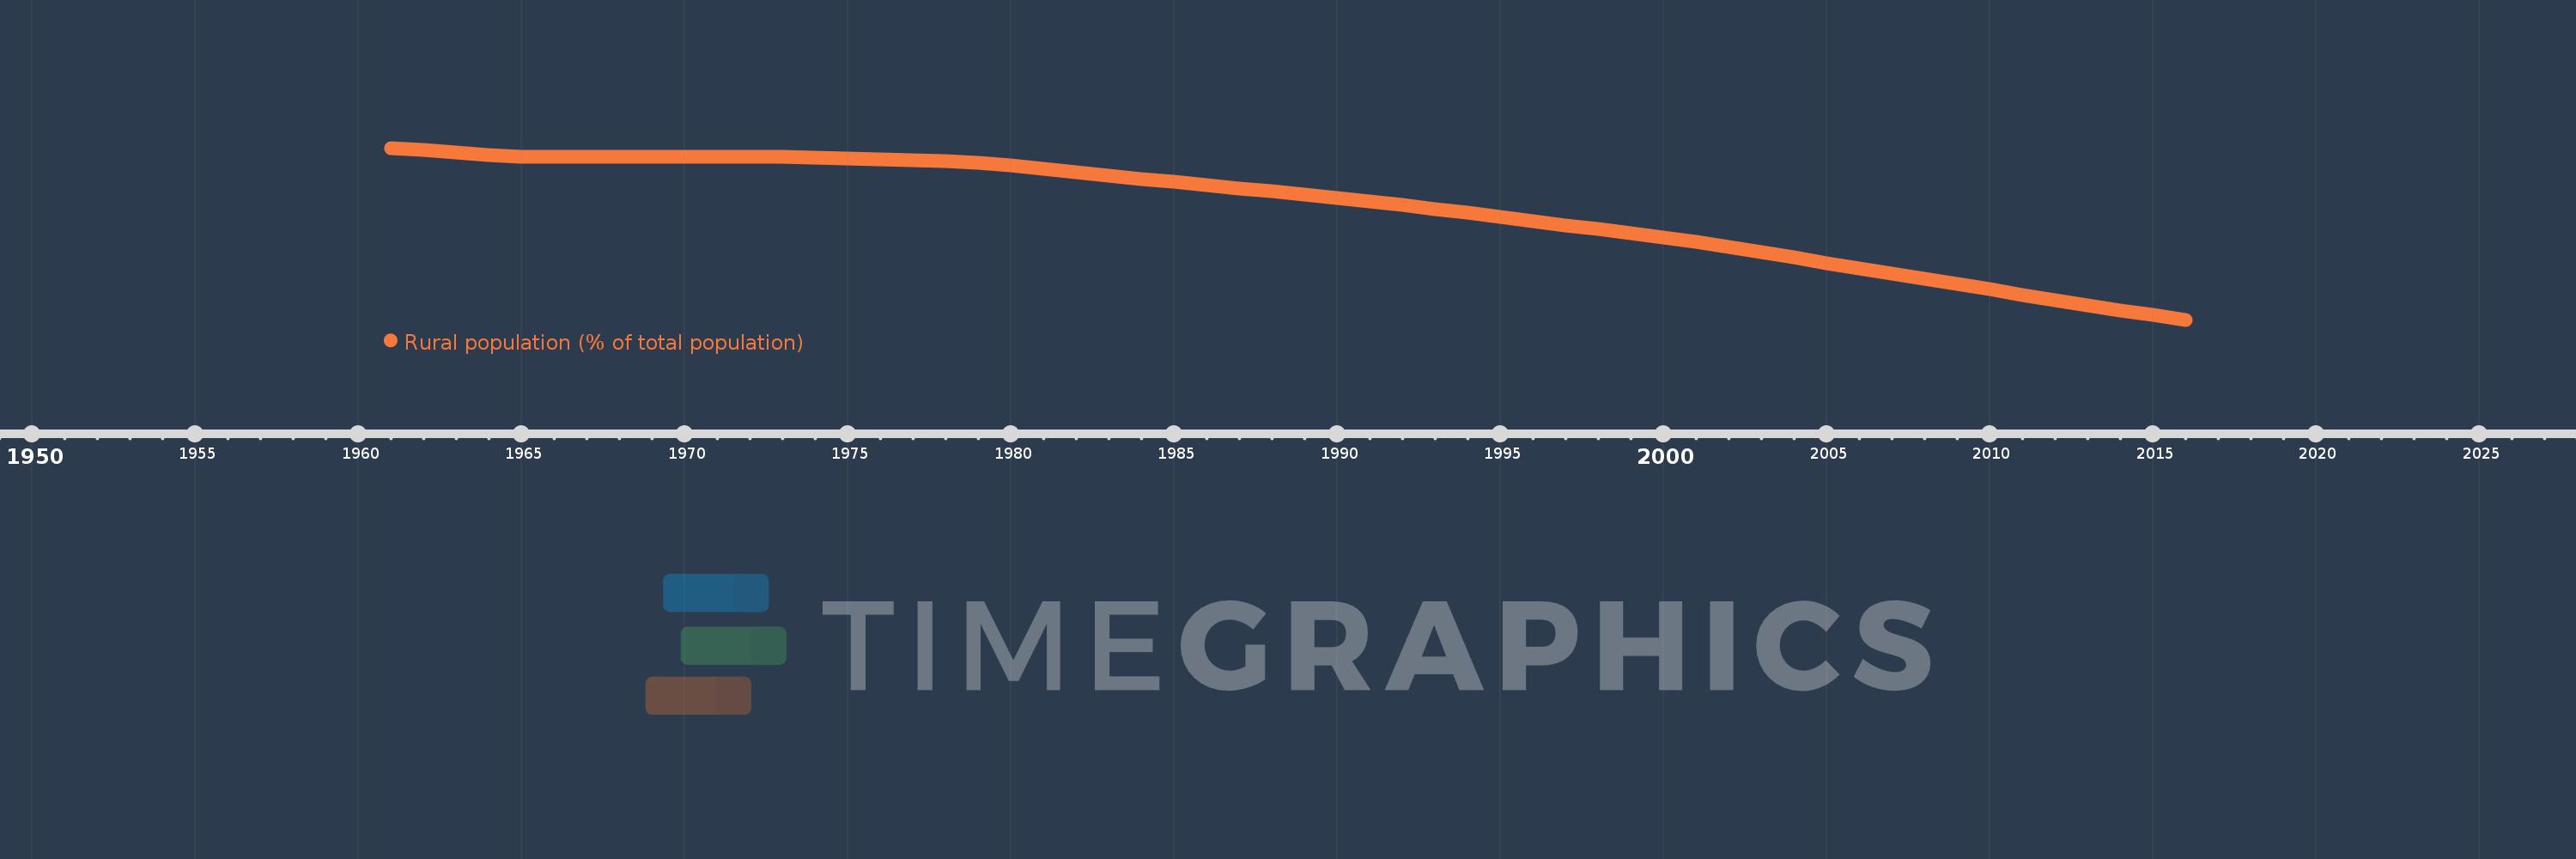
Rural population (% of total population)
2016,2015,2014,2013,2012,2011,2010,2009,2008,2007,2006,2005,2004,2003,2002,2001,2000,1999,1998,1997,1996,1995,1994,1993,1992,1991,1990,1989,1988,1987,1986,1985,1984,1983,1982,1981,1980,1979,1978,1977,1976,1975,1974,1973,1972,1971,1970,1969,1968,1967,1966,1965,1964,1963,1962,1961
This statistics in other country:
AfghanistanAlbaniaAlgeriaAmerican SamoaAndorraAngolaAntigua and BarbudaArab WorldArgentinaArmeniaArubaAustraliaAustriaAzerbaijanBahamas, TheBahrainBangladeshBarbadosBelarusBelgiumBelizeBeninBermudaBhutanBoliviaBosnia and HerzegovinaBotswanaBrazilBritish Virgin IslandsBrunei DarussalamBulgariaBurkina FasoBurundiCabo VerdeCambodiaCameroonCanadaCaribbean small statesCayman IslandsCentral African RepublicCentral Europe and the BalticsChadChannel IslandsChileChinaColombiaComorosCongo, Dem. Rep.Congo, Rep.Costa RicaCote d'IvoireCroatiaCubaCuracaoCyprusCzech RepublicDenmarkDjiboutiDominicaDominican RepublicEarly-demographic dividendEast Asia & PacificEast Asia & Pacific (excluding high income)East Asia & Pacific (IDA & IBRD countries)EcuadorEgypt, Arab Rep.El SalvadorEquatorial GuineaEritreaEstoniaEthiopiaEuro areaEurope & Central AsiaEurope & Central Asia (excluding high income)Europe & Central Asia (IDA & IBRD countries)European UnionFaroe IslandsFijiFinlandFragile and conflict affected situationsFranceFrench PolynesiaGabonGambia, TheGeorgiaGermanyGhanaGibraltarGreeceGreenlandGrenadaGuamGuatemalaGuineaGuinea-BissauGuyanaHaitiHeavily indebted poor countries (HIPC)High incomeHondurasHong Kong SAR, ChinaHungaryIBRD onlyIcelandIDA & IBRD totalIDA blendIDA onlyIDA totalIndiaIndonesiaIran, Islamic Rep.IraqIrelandIsle of ManIsraelItalyJamaicaJapanJordanKazakhstanKenyaKiribatiKorea, Dem. People’s Rep.Korea, Rep.KuwaitKyrgyz RepublicLao PDRLate-demographic dividendLatin America & Caribbean Latin America & Caribbean (excluding high income)Latin America & the Caribbean (IDA & IBRD countries)LatviaLeast developed countries: UN classificationLebanonLesothoLiberiaLibyaLiechtensteinLithuaniaLow & middle incomeLow incomeLower middle incomeLuxembourgMacao SAR, ChinaMacedonia, FYRMadagascarMalawiMalaysiaMaldivesMaliMaltaMarshall IslandsMauritaniaMauritiusMexicoMicronesia, Fed. Sts.Middle East & North AfricaMiddle East & North Africa (excluding high income)Middle East & North Africa (IDA & IBRD countries)Middle incomeMoldovaMonacoMongoliaMontenegroMoroccoMozambiqueMyanmarNamibiaNauruNepalNetherlandsNew CaledoniaNew ZealandNicaraguaNigerNigeriaNorth AmericaNorthern Mariana IslandsNorwayOECD membersOmanOther small statesPacific island small statesPakistanPalauPanamaPapua New GuineaParaguayPeruPhilippinesPolandPortugalPost-demographic dividendPre-demographic dividendPuerto RicoQatarRomaniaRussian FederationRwandaSamoaSan MarinoSao Tome and PrincipeSaudi ArabiaSenegalSerbiaSeychellesSierra LeoneSingaporeSint Maarten (Dutch part)Slovak RepublicSloveniaSmall statesSolomon IslandsSomaliaSouth AfricaSouth AsiaSouth Asia (IDA & IBRD)South SudanSpainSri LankaSt. Kitts and NevisSt. LuciaSt. Vincent and the GrenadinesSub-Saharan Africa Sub-Saharan Africa (excluding high income)Sub-Saharan Africa (IDA & IBRD countries)SudanSurinameSwazilandSwedenSwitzerlandSyrian Arab RepublicTajikistanTanzaniaThailandTimor-LesteTogoTongaTrinidad and TobagoTunisiaTurkeyTurkmenistanTurks and Caicos IslandsTuvaluUgandaUkraineUnited Arab EmiratesUnited KingdomUnited StatesUpper middle incomeUruguayUzbekistanVanuatuVenezuela, RBVietnamVirgin Islands (U.S.)West Bank and GazaWorldYemen, Rep.ZambiaZimbabwe Timeline:
This timeline shows a graph from 1961 to 2016 of East Asia & Pacific (excluding high income). No data until 1960. Number of actual observations by date: 56.
Source name:
World Development Indicators
Source organization:
World Bank Staff estimates based on United Nations, World Urbanization Prospects.
Categories, topics:
Agriculture & Rural Development
Last updated:
apr 23, 2017
Indicators value changes by year
Maximum:
83.082
jan 1, 1961
At the date of observation
Value
Absolute change
Change from previous value
jan 1, 1961
83.082
+83.082
0.0%
jan 1, 1962
82.609
-0.473
-0.57%
jan 1, 1963
82.137
-0.472
-0.57%
jan 1, 1964
81.664
-0.473
-0.58%
jan 1, 1965
81.182
-0.482
-0.59%
jan 1, 1966
81.253
+0.07
0.09%
jan 1, 1967
81.292
+0.04
0.05%
jan 1, 1968
81.292
+0.0
0.0%
jan 1, 1969
81.278
-0.014
-0.02%
jan 1, 1970
81.254
-0.024
-0.03%
jan 1, 1971
81.225
-0.029
-0.04%
jan 1, 1972
81.192
-0.033
-0.04%
jan 1, 1973
81.138
-0.054
-0.07%
jan 1, 1974
80.996
-0.142
-0.17%
jan 1, 1975
80.777
-0.219
-0.27%
jan 1, 1976
80.726
-0.051
-0.06%
jan 1, 1977
80.562
-0.164
-0.2%
jan 1, 1978
80.394
-0.168
-0.21%
jan 1, 1979
79.991
-0.403
-0.5%
jan 1, 1980
79.343
-0.648
-0.81%
jan 1, 1981
78.659
-0.684
-0.86%
jan 1, 1982
77.944
-0.715
-0.91%
jan 1, 1983
77.217
-0.726
-0.93%
jan 1, 1984
76.59
-0.627
-0.81%
jan 1, 1985
75.947
-0.643
-0.84%
jan 1, 1986
75.293
-0.654
-0.86%
jan 1, 1987
74.628
-0.665
-0.88%
jan 1, 1988
73.951
-0.677
-0.91%
jan 1, 1989
73.261
-0.69
-0.93%
jan 1, 1990
72.558
-0.704
-0.96%
jan 1, 1991
71.839
-0.718
-0.99%
jan 1, 1992
71.061
-0.778
-1.08%
jan 1, 1993
70.257
-0.804
-1.13%
jan 1, 1994
69.438
-0.818
-1.16%
jan 1, 1995
68.606
-0.833
-1.2%
jan 1, 1996
67.761
-0.845
-1.23%
jan 1, 1997
66.901
-0.86
-1.27%
jan 1, 1998
66.032
-0.869
-1.3%
jan 1, 1999
65.151
-0.882
-1.34%
jan 1, 2000
64.257
-0.893
-1.37%
jan 1, 2001
63.34
-0.917
-1.43%
jan 1, 2002
62.315
-1.025
-1.62%
jan 1, 2003
61.209
-1.106
-1.77%
jan 1, 2004
60.091
-1.118
-1.83%
jan 1, 2005
58.962
-1.129
-1.88%
jan 1, 2006
57.828
-1.135
-1.92%
jan 1, 2007
56.716
-1.112
-1.92%
jan 1, 2008
55.615
-1.101
-1.94%
jan 1, 2009
54.509
-1.106
-1.99%
jan 1, 2010
53.404
-1.105
-2.03%
jan 1, 2011
52.298
-1.106
-2.07%
jan 1, 2012
51.196
-1.103
-2.11%
jan 1, 2013
50.118
-1.077
-2.1%
jan 1, 2014
49.07
-1.048
-2.09%
jan 1, 2015
48.05
-1.019
-2.08%
jan 1, 2016
47.06
-0.99
-2.06%
Ranking of countries by current statistics by years


Comments: