29
/
en
AIzaSyAYiBZKx7MnpbEhh9jyipgxe19OcubqV5w
April 1, 2024
189597
Maldives
MDV
true
2
1
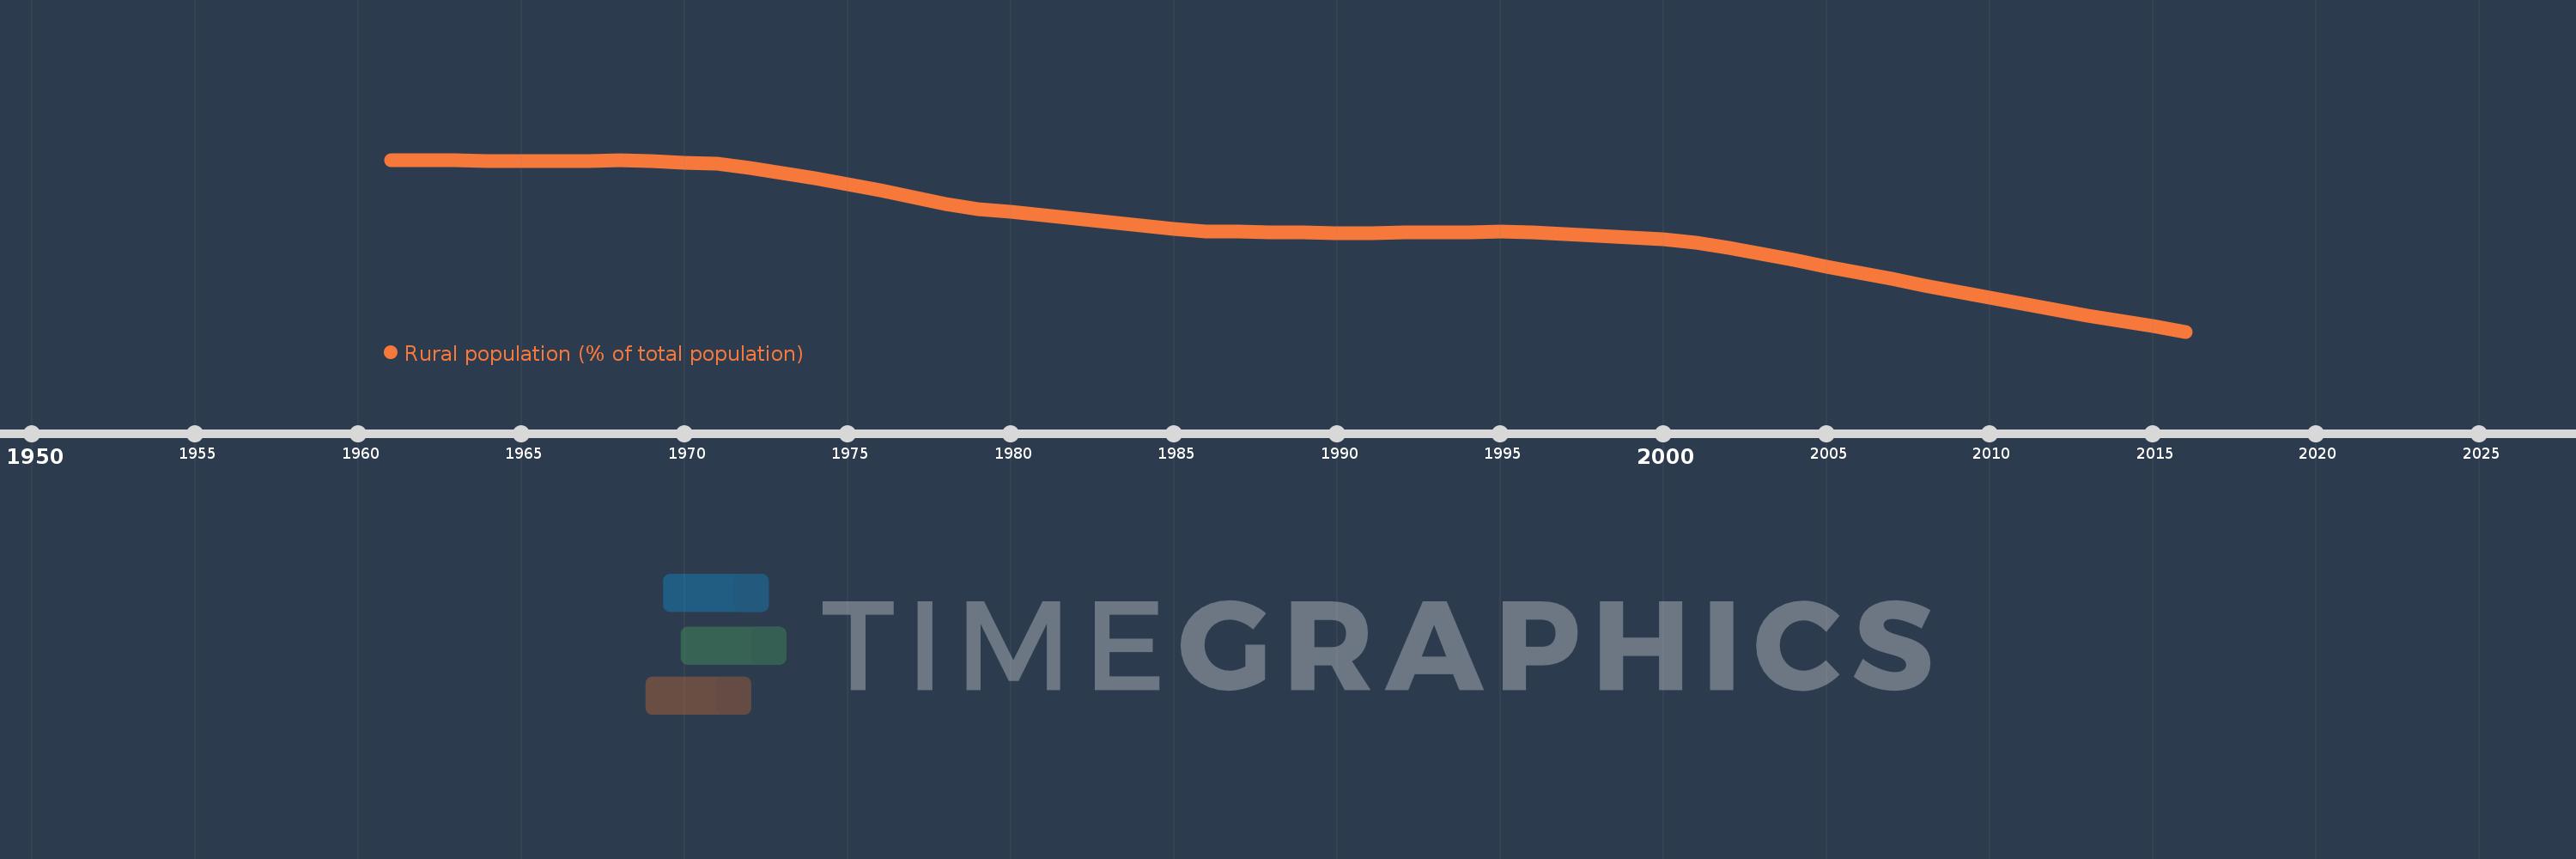
Rural population (% of total population)
2016,2015,2014,2013,2012,2011,2010,2009,2008,2007,2006,2005,2004,2003,2002,2001,2000,1999,1998,1997,1996,1995,1994,1993,1992,1991,1990,1989,1988,1987,1986,1985,1984,1983,1982,1981,1980,1979,1978,1977,1976,1975,1974,1973,1972,1971,1970,1969,1968,1967,1966,1965,1964,1963,1962,1961
This statistics in other country:
AfghanistanAlbaniaAlgeriaAmerican SamoaAndorraAngolaAntigua and BarbudaArab WorldArgentinaArmeniaArubaAustraliaAustriaAzerbaijanBahamas, TheBahrainBangladeshBarbadosBelarusBelgiumBelizeBeninBermudaBhutanBoliviaBosnia and HerzegovinaBotswanaBrazilBritish Virgin IslandsBrunei DarussalamBulgariaBurkina FasoBurundiCabo VerdeCambodiaCameroonCanadaCaribbean small statesCayman IslandsCentral African RepublicCentral Europe and the BalticsChadChannel IslandsChileChinaColombiaComorosCongo, Dem. Rep.Congo, Rep.Costa RicaCote d'IvoireCroatiaCubaCuracaoCyprusCzech RepublicDenmarkDjiboutiDominicaDominican RepublicEarly-demographic dividendEast Asia & PacificEast Asia & Pacific (excluding high income)East Asia & Pacific (IDA & IBRD countries)EcuadorEgypt, Arab Rep.El SalvadorEquatorial GuineaEritreaEstoniaEthiopiaEuro areaEurope & Central AsiaEurope & Central Asia (excluding high income)Europe & Central Asia (IDA & IBRD countries)European UnionFaroe IslandsFijiFinlandFragile and conflict affected situationsFranceFrench PolynesiaGabonGambia, TheGeorgiaGermanyGhanaGibraltarGreeceGreenlandGrenadaGuamGuatemalaGuineaGuinea-BissauGuyanaHaitiHeavily indebted poor countries (HIPC)High incomeHondurasHong Kong SAR, ChinaHungaryIBRD onlyIcelandIDA & IBRD totalIDA blendIDA onlyIDA totalIndiaIndonesiaIran, Islamic Rep.IraqIrelandIsle of ManIsraelItalyJamaicaJapanJordanKazakhstanKenyaKiribatiKorea, Dem. People’s Rep.Korea, Rep.KuwaitKyrgyz RepublicLao PDRLate-demographic dividendLatin America & Caribbean Latin America & Caribbean (excluding high income)Latin America & the Caribbean (IDA & IBRD countries)LatviaLeast developed countries: UN classificationLebanonLesothoLiberiaLibyaLiechtensteinLithuaniaLow & middle incomeLow incomeLower middle incomeLuxembourgMacao SAR, ChinaMacedonia, FYRMadagascarMalawiMalaysiaMaldivesMaliMaltaMarshall IslandsMauritaniaMauritiusMexicoMicronesia, Fed. Sts.Middle East & North AfricaMiddle East & North Africa (excluding high income)Middle East & North Africa (IDA & IBRD countries)Middle incomeMoldovaMonacoMongoliaMontenegroMoroccoMozambiqueMyanmarNamibiaNauruNepalNetherlandsNew CaledoniaNew ZealandNicaraguaNigerNigeriaNorth AmericaNorthern Mariana IslandsNorwayOECD membersOmanOther small statesPacific island small statesPakistanPalauPanamaPapua New GuineaParaguayPeruPhilippinesPolandPortugalPost-demographic dividendPre-demographic dividendPuerto RicoQatarRomaniaRussian FederationRwandaSamoaSan MarinoSao Tome and PrincipeSaudi ArabiaSenegalSerbiaSeychellesSierra LeoneSingaporeSint Maarten (Dutch part)Slovak RepublicSloveniaSmall statesSolomon IslandsSomaliaSouth AfricaSouth AsiaSouth Asia (IDA & IBRD)South SudanSpainSri LankaSt. Kitts and NevisSt. LuciaSt. Vincent and the GrenadinesSub-Saharan Africa Sub-Saharan Africa (excluding high income)Sub-Saharan Africa (IDA & IBRD countries)SudanSurinameSwazilandSwedenSwitzerlandSyrian Arab RepublicTajikistanTanzaniaThailandTimor-LesteTogoTongaTrinidad and TobagoTunisiaTurkeyTurkmenistanTurks and Caicos IslandsTuvaluUgandaUkraineUnited Arab EmiratesUnited KingdomUnited StatesUpper middle incomeUruguayUzbekistanVanuatuVenezuela, RBVietnamVirgin Islands (U.S.)West Bank and GazaWorldYemen, Rep.ZambiaZimbabwe Timeline:
This timeline shows a graph from 1961 to 2016 of Maldives. No data until 1960. Number of actual observations by date: 56.
Source name:
World Development Indicators
Source organization:
World Bank Staff estimates based on United Nations, World Urbanization Prospects.
Categories, topics:
Agriculture & Rural Development
Last updated:
apr 23, 2017
Indicators value changes by year
Minimum:
54.464
jan 1, 2016
Maximum:
88.827
jan 1, 1961
At the date of observation
Value
Absolute change
Change from previous value
jan 1, 1961
88.827
+88.827
0.0%
jan 1, 1962
88.77
-0.057
-0.06%
jan 1, 1963
88.712
-0.058
-0.07%
jan 1, 1964
88.655
-0.057
-0.06%
jan 1, 1965
88.596
-0.059
-0.07%
jan 1, 1966
88.542
-0.054
-0.06%
jan 1, 1967
88.607
+0.065
0.07%
jan 1, 1968
88.664
+0.057
0.06%
jan 1, 1969
88.484
-0.18
-0.2%
jan 1, 1970
88.302
-0.182
-0.21%
jan 1, 1971
88.107
-0.195
-0.22%
jan 1, 1972
87.158
-0.949
-1.08%
jan 1, 1973
86.142
-1.016
-1.17%
jan 1, 1974
85.064
-1.078
-1.25%
jan 1, 1975
83.915
-1.149
-1.35%
jan 1, 1976
82.696
-1.219
-1.45%
jan 1, 1977
81.404
-1.292
-1.56%
jan 1, 1978
80.042
-1.362
-1.67%
jan 1, 1979
79.022
-1.02
-1.27%
jan 1, 1980
78.393
-0.629
-0.8%
jan 1, 1981
77.75
-0.643
-0.82%
jan 1, 1982
77.095
-0.655
-0.84%
jan 1, 1983
76.426
-0.669
-0.87%
jan 1, 1984
75.743
-0.683
-0.89%
jan 1, 1985
75.046
-0.697
-0.92%
jan 1, 1986
74.509
-0.537
-0.72%
jan 1, 1987
74.43
-0.079
-0.11%
jan 1, 1988
74.352
-0.078
-0.1%
jan 1, 1989
74.273
-0.079
-0.11%
jan 1, 1990
74.194
-0.079
-0.11%
jan 1, 1991
74.16
-0.034
-0.05%
jan 1, 1992
74.224
+0.064
0.09%
jan 1, 1993
74.287
+0.063
0.08%
jan 1, 1994
74.351
+0.064
0.09%
jan 1, 1995
74.414
+0.063
0.08%
jan 1, 1996
74.362
-0.052
-0.07%
jan 1, 1997
73.992
-0.37
-0.5%
jan 1, 1998
73.621
-0.371
-0.5%
jan 1, 1999
73.245
-0.376
-0.51%
jan 1, 2000
72.866
-0.379
-0.52%
jan 1, 2001
72.294
-0.572
-0.79%
jan 1, 2002
71.141
-1.153
-1.59%
jan 1, 2003
69.958
-1.183
-1.66%
jan 1, 2004
68.748
-1.21
-1.73%
jan 1, 2005
67.51
-1.238
-1.8%
jan 1, 2006
66.25
-1.26
-1.87%
jan 1, 2007
64.966
-1.284
-1.94%
jan 1, 2008
63.697
-1.269
-1.95%
jan 1, 2009
62.447
-1.25
-1.96%
jan 1, 2010
61.219
-1.228
-1.97%
jan 1, 2011
60.016
-1.203
-1.97%
jan 1, 2012
58.841
-1.175
-1.96%
jan 1, 2013
57.697
-1.144
-1.94%
jan 1, 2014
56.584
-1.113
-1.93%
jan 1, 2015
55.506
-1.078
-1.91%
jan 1, 2016
54.464
-1.042
-1.88%
Ranking of countries by current statistics by years


Comments: