29
/
en
AIzaSyAYiBZKx7MnpbEhh9jyipgxe19OcubqV5w
April 1, 2024
220201
Papua New Guinea
PNG
true
2
1
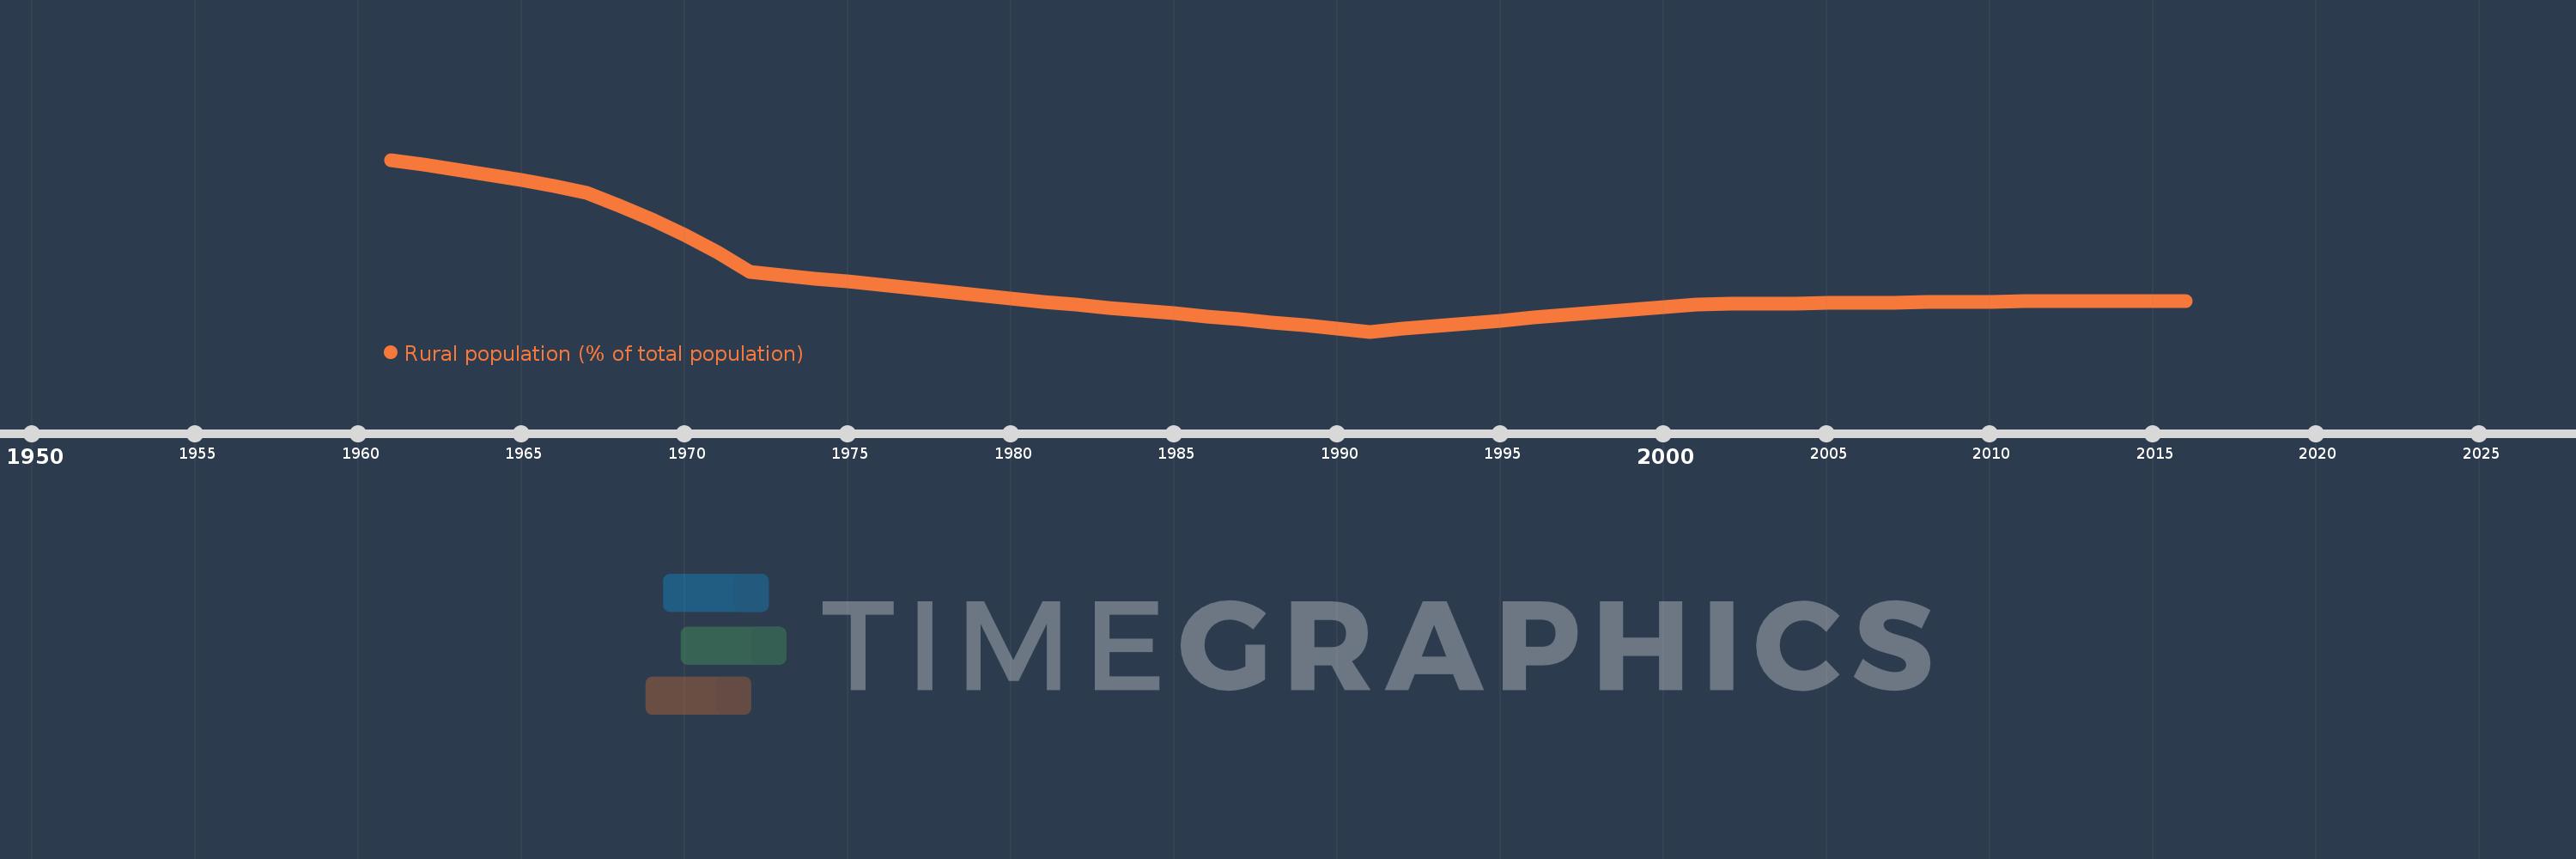
Rural population (% of total population)
2016,2015,2014,2013,2012,2011,2010,2009,2008,2007,2006,2005,2004,2003,2002,2001,2000,1999,1998,1997,1996,1995,1994,1993,1992,1991,1990,1989,1988,1987,1986,1985,1984,1983,1982,1981,1980,1979,1978,1977,1976,1975,1974,1973,1972,1971,1970,1969,1968,1967,1966,1965,1964,1963,1962,1961
This statistics in other country:
AfghanistanAlbaniaAlgeriaAmerican SamoaAndorraAngolaAntigua and BarbudaArab WorldArgentinaArmeniaArubaAustraliaAustriaAzerbaijanBahamas, TheBahrainBangladeshBarbadosBelarusBelgiumBelizeBeninBermudaBhutanBoliviaBosnia and HerzegovinaBotswanaBrazilBritish Virgin IslandsBrunei DarussalamBulgariaBurkina FasoBurundiCabo VerdeCambodiaCameroonCanadaCaribbean small statesCayman IslandsCentral African RepublicCentral Europe and the BalticsChadChannel IslandsChileChinaColombiaComorosCongo, Dem. Rep.Congo, Rep.Costa RicaCote d'IvoireCroatiaCubaCuracaoCyprusCzech RepublicDenmarkDjiboutiDominicaDominican RepublicEarly-demographic dividendEast Asia & PacificEast Asia & Pacific (excluding high income)East Asia & Pacific (IDA & IBRD countries)EcuadorEgypt, Arab Rep.El SalvadorEquatorial GuineaEritreaEstoniaEthiopiaEuro areaEurope & Central AsiaEurope & Central Asia (excluding high income)Europe & Central Asia (IDA & IBRD countries)European UnionFaroe IslandsFijiFinlandFragile and conflict affected situationsFranceFrench PolynesiaGabonGambia, TheGeorgiaGermanyGhanaGibraltarGreeceGreenlandGrenadaGuamGuatemalaGuineaGuinea-BissauGuyanaHaitiHeavily indebted poor countries (HIPC)High incomeHondurasHong Kong SAR, ChinaHungaryIBRD onlyIcelandIDA & IBRD totalIDA blendIDA onlyIDA totalIndiaIndonesiaIran, Islamic Rep.IraqIrelandIsle of ManIsraelItalyJamaicaJapanJordanKazakhstanKenyaKiribatiKorea, Dem. People’s Rep.Korea, Rep.KuwaitKyrgyz RepublicLao PDRLate-demographic dividendLatin America & Caribbean Latin America & Caribbean (excluding high income)Latin America & the Caribbean (IDA & IBRD countries)LatviaLeast developed countries: UN classificationLebanonLesothoLiberiaLibyaLiechtensteinLithuaniaLow & middle incomeLow incomeLower middle incomeLuxembourgMacao SAR, ChinaMacedonia, FYRMadagascarMalawiMalaysiaMaldivesMaliMaltaMarshall IslandsMauritaniaMauritiusMexicoMicronesia, Fed. Sts.Middle East & North AfricaMiddle East & North Africa (excluding high income)Middle East & North Africa (IDA & IBRD countries)Middle incomeMoldovaMonacoMongoliaMontenegroMoroccoMozambiqueMyanmarNamibiaNauruNepalNetherlandsNew CaledoniaNew ZealandNicaraguaNigerNigeriaNorth AmericaNorthern Mariana IslandsNorwayOECD membersOmanOther small statesPacific island small statesPakistanPalauPanamaPapua New GuineaParaguayPeruPhilippinesPolandPortugalPost-demographic dividendPre-demographic dividendPuerto RicoQatarRomaniaRussian FederationRwandaSamoaSan MarinoSao Tome and PrincipeSaudi ArabiaSenegalSerbiaSeychellesSierra LeoneSingaporeSint Maarten (Dutch part)Slovak RepublicSloveniaSmall statesSolomon IslandsSomaliaSouth AfricaSouth AsiaSouth Asia (IDA & IBRD)South SudanSpainSri LankaSt. Kitts and NevisSt. LuciaSt. Vincent and the GrenadinesSub-Saharan Africa Sub-Saharan Africa (excluding high income)Sub-Saharan Africa (IDA & IBRD countries)SudanSurinameSwazilandSwedenSwitzerlandSyrian Arab RepublicTajikistanTanzaniaThailandTimor-LesteTogoTongaTrinidad and TobagoTunisiaTurkeyTurkmenistanTurks and Caicos IslandsTuvaluUgandaUkraineUnited Arab EmiratesUnited KingdomUnited StatesUpper middle incomeUruguayUzbekistanVanuatuVenezuela, RBVietnamVirgin Islands (U.S.)West Bank and GazaWorldYemen, Rep.ZambiaZimbabwe Timeline:
This timeline shows a graph from 1961 to 2016 of Papua New Guinea. No data until 1960. Number of actual observations by date: 56.
Source name:
World Development Indicators
Source organization:
World Bank Staff estimates based on United Nations, World Urbanization Prospects.
Categories, topics:
Agriculture & Rural Development
Last updated:
apr 23, 2017
Indicators value changes by year
Minimum:
85.006
jan 1, 1991
Maximum:
96.275
jan 1, 1961
At the date of observation
Value
Absolute change
Change from previous value
jan 1, 1961
96.275
+96.275
0.0%
jan 1, 1962
95.976
-0.299
-0.31%
jan 1, 1963
95.653
-0.323
-0.34%
jan 1, 1964
95.306
-0.347
-0.36%
jan 1, 1965
94.931
-0.375
-0.39%
jan 1, 1966
94.53
-0.401
-0.42%
jan 1, 1967
94.098
-0.432
-0.46%
jan 1, 1968
93.288
-0.81
-0.86%
jan 1, 1969
92.375
-0.913
-0.98%
jan 1, 1970
91.351
-1.024
-1.11%
jan 1, 1971
90.204
-1.147
-1.26%
jan 1, 1972
88.922
-1.282
-1.42%
jan 1, 1973
88.7
-0.222
-0.25%
jan 1, 1974
88.493
-0.207
-0.23%
jan 1, 1975
88.283
-0.21
-0.24%
jan 1, 1976
88.07
-0.213
-0.24%
jan 1, 1977
87.853
-0.217
-0.25%
jan 1, 1978
87.634
-0.219
-0.25%
jan 1, 1979
87.41
-0.224
-0.26%
jan 1, 1980
87.183
-0.227
-0.26%
jan 1, 1981
86.953
-0.23
-0.26%
jan 1, 1982
86.758
-0.195
-0.22%
jan 1, 1983
86.572
-0.186
-0.21%
jan 1, 1984
86.384
-0.188
-0.22%
jan 1, 1985
86.194
-0.19
-0.22%
jan 1, 1986
86.002
-0.192
-0.22%
jan 1, 1987
85.807
-0.195
-0.23%
jan 1, 1988
85.61
-0.197
-0.23%
jan 1, 1989
85.411
-0.199
-0.23%
jan 1, 1990
85.209
-0.202
-0.24%
jan 1, 1991
85.006
-0.203
-0.24%
jan 1, 1992
85.184
+0.178
0.21%
jan 1, 1993
85.371
+0.187
0.22%
jan 1, 1994
85.555
+0.184
0.22%
jan 1, 1995
85.738
+0.183
0.21%
jan 1, 1996
85.919
+0.181
0.21%
jan 1, 1997
86.099
+0.18
0.21%
jan 1, 1998
86.276
+0.177
0.21%
jan 1, 1999
86.451
+0.175
0.2%
jan 1, 2000
86.625
+0.174
0.2%
jan 1, 2001
86.796
+0.171
0.2%
jan 1, 2002
86.818
+0.022
0.03%
jan 1, 2003
86.836
+0.018
0.02%
jan 1, 2004
86.854
+0.018
0.02%
jan 1, 2005
86.873
+0.019
0.02%
jan 1, 2006
86.891
+0.018
0.02%
jan 1, 2007
86.909
+0.018
0.02%
jan 1, 2008
86.927
+0.018
0.02%
jan 1, 2009
86.945
+0.018
0.02%
jan 1, 2010
86.963
+0.018
0.02%
jan 1, 2011
86.981
+0.018
0.02%
jan 1, 2012
87.0
+0.019
0.02%
jan 1, 2013
87.018
+0.018
0.02%
jan 1, 2014
87.023
+0.005
0.01%
jan 1, 2015
87.015
-0.008
-0.01%
jan 1, 2016
86.995
-0.02
-0.02%
Ranking of countries by current statistics by years


Comments: