29
/
en
AIzaSyAYiBZKx7MnpbEhh9jyipgxe19OcubqV5w
April 1, 2024
149736
Haiti
HTI
true
2
1
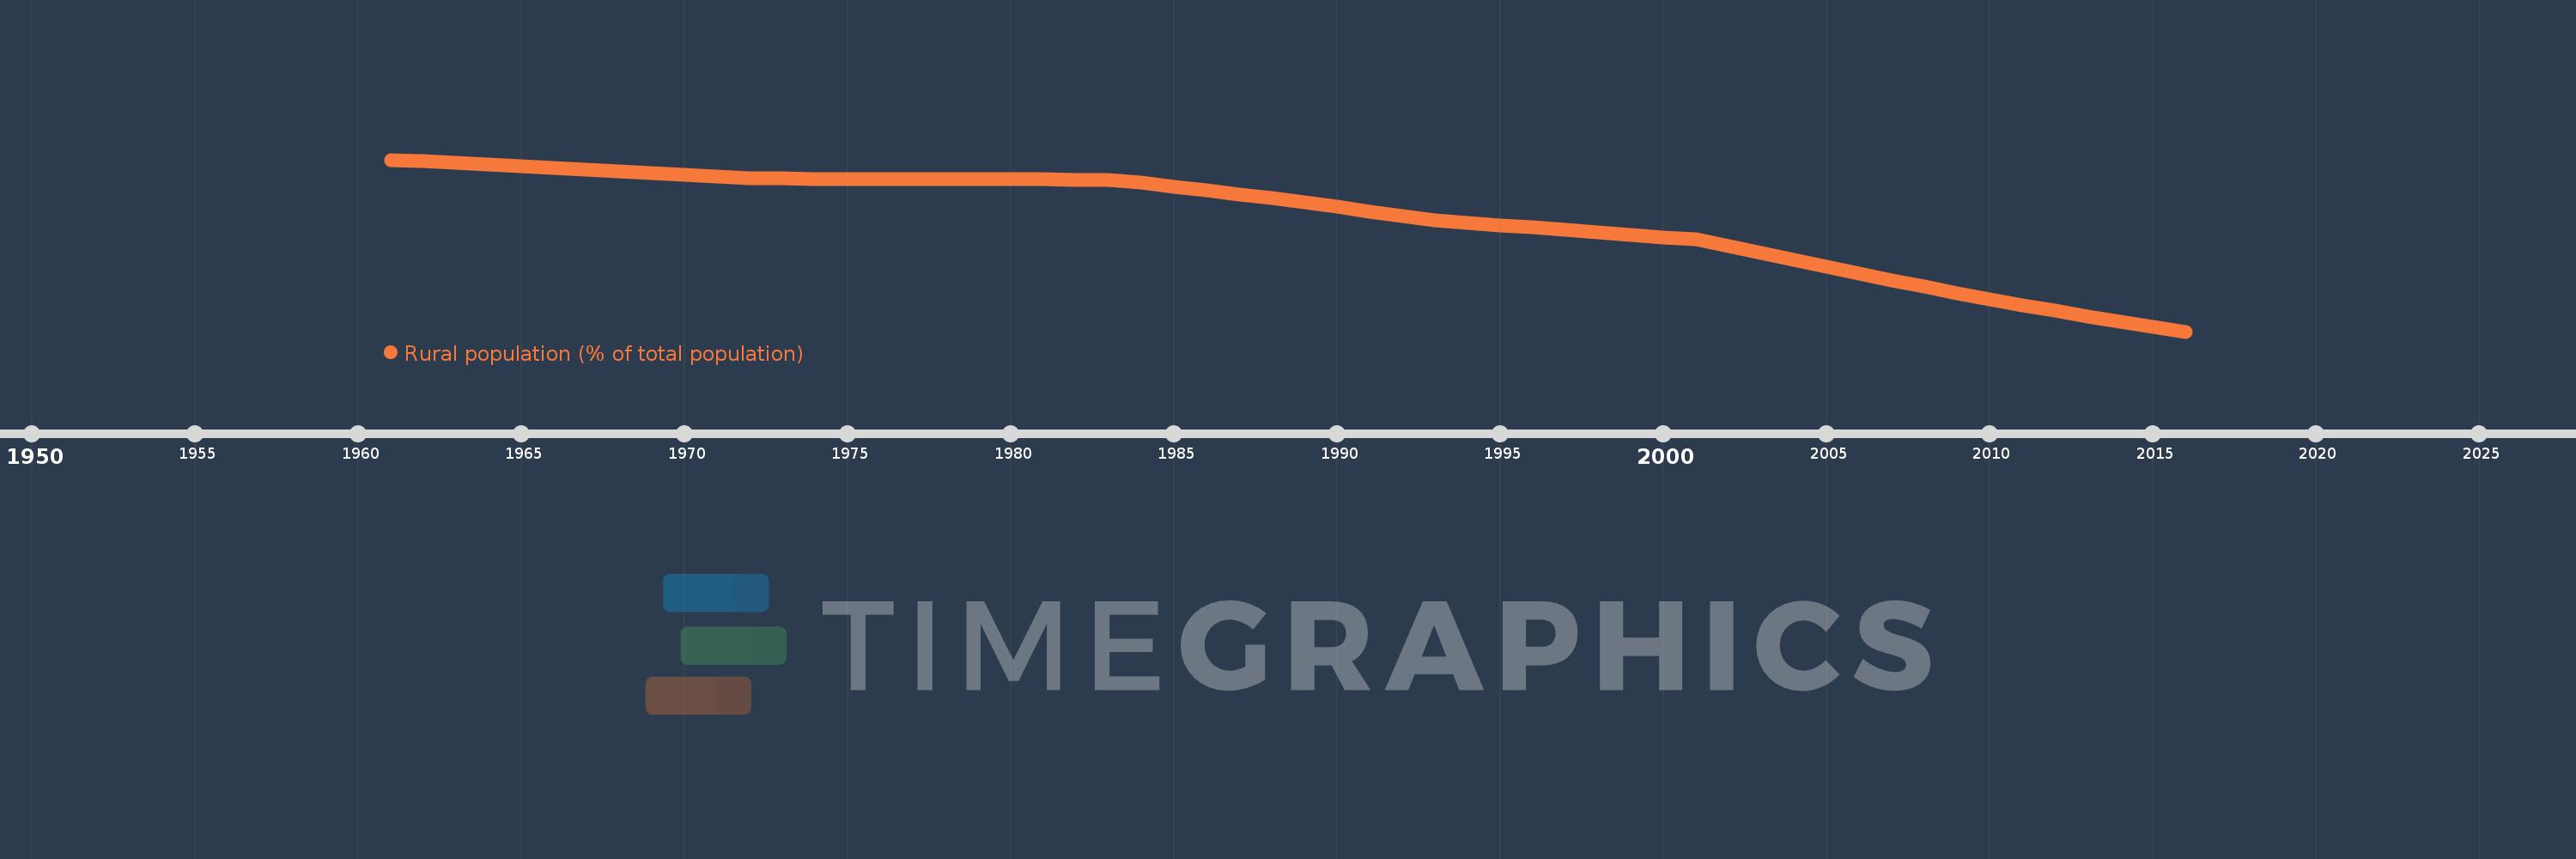
Rural population (% of total population)
2016,2015,2014,2013,2012,2011,2010,2009,2008,2007,2006,2005,2004,2003,2002,2001,2000,1999,1998,1997,1996,1995,1994,1993,1992,1991,1990,1989,1988,1987,1986,1985,1984,1983,1982,1981,1980,1979,1978,1977,1976,1975,1974,1973,1972,1971,1970,1969,1968,1967,1966,1965,1964,1963,1962,1961
This statistics in other country:
AfghanistanAlbaniaAlgeriaAmerican SamoaAndorraAngolaAntigua and BarbudaArab WorldArgentinaArmeniaArubaAustraliaAustriaAzerbaijanBahamas, TheBahrainBangladeshBarbadosBelarusBelgiumBelizeBeninBermudaBhutanBoliviaBosnia and HerzegovinaBotswanaBrazilBritish Virgin IslandsBrunei DarussalamBulgariaBurkina FasoBurundiCabo VerdeCambodiaCameroonCanadaCaribbean small statesCayman IslandsCentral African RepublicCentral Europe and the BalticsChadChannel IslandsChileChinaColombiaComorosCongo, Dem. Rep.Congo, Rep.Costa RicaCote d'IvoireCroatiaCubaCuracaoCyprusCzech RepublicDenmarkDjiboutiDominicaDominican RepublicEarly-demographic dividendEast Asia & PacificEast Asia & Pacific (excluding high income)East Asia & Pacific (IDA & IBRD countries)EcuadorEgypt, Arab Rep.El SalvadorEquatorial GuineaEritreaEstoniaEthiopiaEuro areaEurope & Central AsiaEurope & Central Asia (excluding high income)Europe & Central Asia (IDA & IBRD countries)European UnionFaroe IslandsFijiFinlandFragile and conflict affected situationsFranceFrench PolynesiaGabonGambia, TheGeorgiaGermanyGhanaGibraltarGreeceGreenlandGrenadaGuamGuatemalaGuineaGuinea-BissauGuyanaHaitiHeavily indebted poor countries (HIPC)High incomeHondurasHong Kong SAR, ChinaHungaryIBRD onlyIcelandIDA & IBRD totalIDA blendIDA onlyIDA totalIndiaIndonesiaIran, Islamic Rep.IraqIrelandIsle of ManIsraelItalyJamaicaJapanJordanKazakhstanKenyaKiribatiKorea, Dem. People’s Rep.Korea, Rep.KuwaitKyrgyz RepublicLao PDRLate-demographic dividendLatin America & Caribbean Latin America & Caribbean (excluding high income)Latin America & the Caribbean (IDA & IBRD countries)LatviaLeast developed countries: UN classificationLebanonLesothoLiberiaLibyaLiechtensteinLithuaniaLow & middle incomeLow incomeLower middle incomeLuxembourgMacao SAR, ChinaMacedonia, FYRMadagascarMalawiMalaysiaMaldivesMaliMaltaMarshall IslandsMauritaniaMauritiusMexicoMicronesia, Fed. Sts.Middle East & North AfricaMiddle East & North Africa (excluding high income)Middle East & North Africa (IDA & IBRD countries)Middle incomeMoldovaMonacoMongoliaMontenegroMoroccoMozambiqueMyanmarNamibiaNauruNepalNetherlandsNew CaledoniaNew ZealandNicaraguaNigerNigeriaNorth AmericaNorthern Mariana IslandsNorwayOECD membersOmanOther small statesPacific island small statesPakistanPalauPanamaPapua New GuineaParaguayPeruPhilippinesPolandPortugalPost-demographic dividendPre-demographic dividendPuerto RicoQatarRomaniaRussian FederationRwandaSamoaSan MarinoSao Tome and PrincipeSaudi ArabiaSenegalSerbiaSeychellesSierra LeoneSingaporeSint Maarten (Dutch part)Slovak RepublicSloveniaSmall statesSolomon IslandsSomaliaSouth AfricaSouth AsiaSouth Asia (IDA & IBRD)South SudanSpainSri LankaSt. Kitts and NevisSt. LuciaSt. Vincent and the GrenadinesSub-Saharan Africa Sub-Saharan Africa (excluding high income)Sub-Saharan Africa (IDA & IBRD countries)SudanSurinameSwazilandSwedenSwitzerlandSyrian Arab RepublicTajikistanTanzaniaThailandTimor-LesteTogoTongaTrinidad and TobagoTunisiaTurkeyTurkmenistanTurks and Caicos IslandsTuvaluUgandaUkraineUnited Arab EmiratesUnited KingdomUnited StatesUpper middle incomeUruguayUzbekistanVanuatuVenezuela, RBVietnamVirgin Islands (U.S.)West Bank and GazaWorldYemen, Rep.ZambiaZimbabwe Timeline:
This timeline shows a graph from 1961 to 2016 of Haiti. No data until 1960. Number of actual observations by date: 56.
Source name:
World Development Indicators
Source organization:
World Bank Staff estimates based on United Nations, World Urbanization Prospects.
Categories, topics:
Agriculture & Rural Development
Last updated:
apr 23, 2017
Indicators value changes by year
Minimum:
41.355
jan 1, 2016
Maximum:
84.407
jan 1, 1961
At the date of observation
Value
Absolute change
Change from previous value
jan 1, 1961
84.407
+84.407
0.0%
jan 1, 1962
84.025
-0.382
-0.45%
jan 1, 1963
83.635
-0.39
-0.46%
jan 1, 1964
83.238
-0.397
-0.47%
jan 1, 1965
82.832
-0.406
-0.49%
jan 1, 1966
82.42
-0.412
-0.5%
jan 1, 1967
81.999
-0.421
-0.51%
jan 1, 1968
81.571
-0.428
-0.52%
jan 1, 1969
81.134
-0.437
-0.54%
jan 1, 1970
80.69
-0.444
-0.55%
jan 1, 1971
80.238
-0.452
-0.56%
jan 1, 1972
79.778
-0.46
-0.57%
jan 1, 1973
79.677
-0.101
-0.13%
jan 1, 1974
79.65
-0.027
-0.03%
jan 1, 1975
79.623
-0.027
-0.03%
jan 1, 1976
79.596
-0.027
-0.03%
jan 1, 1977
79.569
-0.027
-0.03%
jan 1, 1978
79.541
-0.028
-0.04%
jan 1, 1979
79.514
-0.027
-0.03%
jan 1, 1980
79.487
-0.027
-0.03%
jan 1, 1981
79.459
-0.028
-0.04%
jan 1, 1982
79.432
-0.027
-0.03%
jan 1, 1983
79.405
-0.027
-0.03%
jan 1, 1984
78.64
-0.765
-0.96%
jan 1, 1985
77.703
-0.937
-1.19%
jan 1, 1986
76.739
-0.964
-1.24%
jan 1, 1987
75.745
-0.994
-1.3%
jan 1, 1988
74.723
-1.022
-1.35%
jan 1, 1989
73.671
-1.052
-1.41%
jan 1, 1990
72.595
-1.076
-1.46%
jan 1, 1991
71.49
-1.105
-1.52%
jan 1, 1992
70.359
-1.131
-1.58%
jan 1, 1993
69.2
-1.159
-1.65%
jan 1, 1994
68.61
-0.59
-0.85%
jan 1, 1995
68.013
-0.597
-0.87%
jan 1, 1996
67.41
-0.603
-0.89%
jan 1, 1997
66.8
-0.61
-0.9%
jan 1, 1998
66.208
-0.592
-0.89%
jan 1, 1999
65.611
-0.597
-0.9%
jan 1, 2000
65.008
-0.603
-0.92%
jan 1, 2001
64.4
-0.608
-0.94%
jan 1, 2002
62.749
-1.651
-2.56%
jan 1, 2003
61.065
-1.684
-2.68%
jan 1, 2004
59.355
-1.71
-2.8%
jan 1, 2005
57.619
-1.736
-2.92%
jan 1, 2006
55.916
-1.703
-2.96%
jan 1, 2007
54.244
-1.672
-2.99%
jan 1, 2008
52.61
-1.634
-3.01%
jan 1, 2009
51.02
-1.59
-3.02%
jan 1, 2010
49.477
-1.543
-3.02%
jan 1, 2011
47.984
-1.493
-3.02%
jan 1, 2012
46.544
-1.44
-3.0%
jan 1, 2013
45.159
-1.385
-2.98%
jan 1, 2014
43.832
-1.327
-2.94%
jan 1, 2015
42.564
-1.268
-2.89%
jan 1, 2016
41.355
-1.209
-2.84%
Ranking of countries by current statistics by years


Comments: