29
/
en
AIzaSyAYiBZKx7MnpbEhh9jyipgxe19OcubqV5w
April 1, 2024
128843
Eritrea
ERI
true
2
1
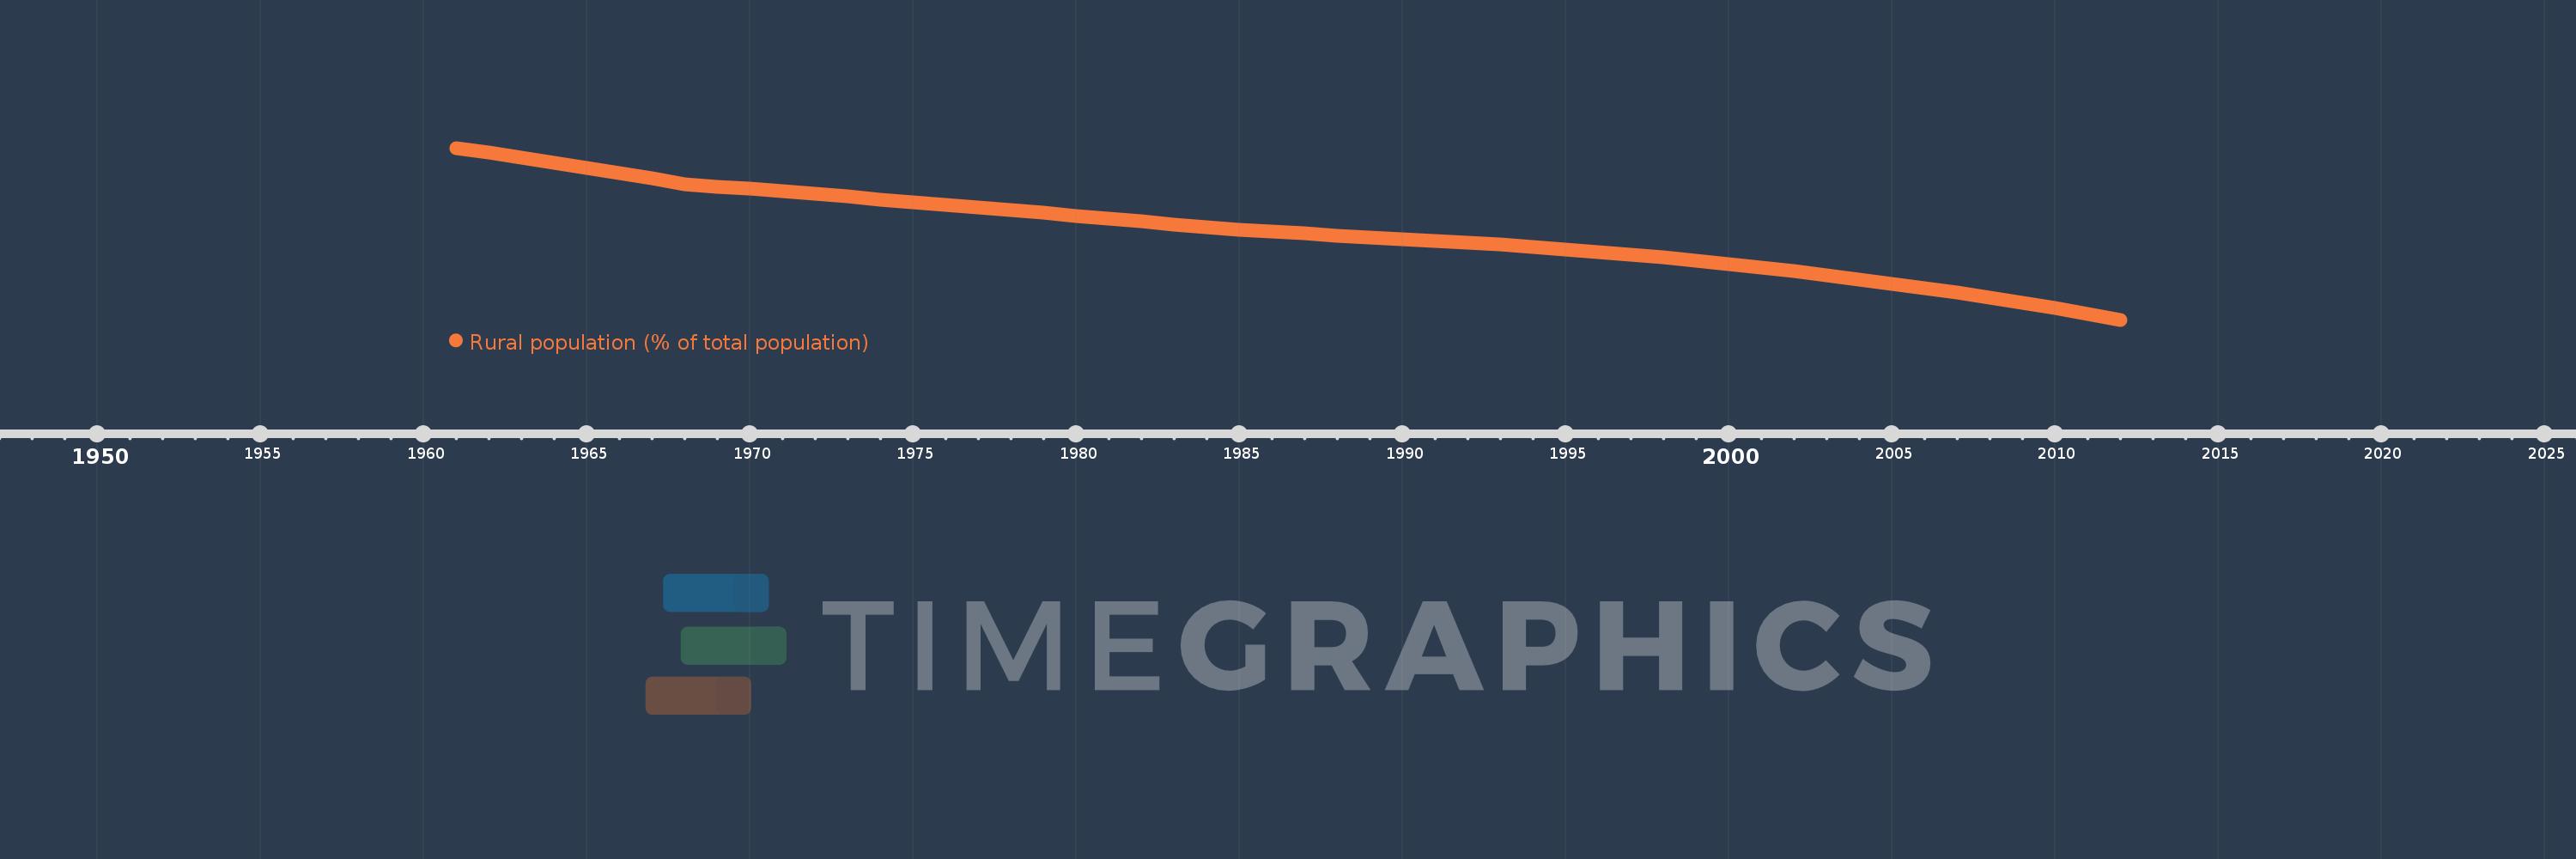
Rural population (% of total population)
2012,2011,2010,2009,2008,2007,2006,2005,2004,2003,2002,2001,2000,1999,1998,1997,1996,1995,1994,1993,1992,1991,1990,1989,1988,1987,1986,1985,1984,1983,1982,1981,1980,1979,1978,1977,1976,1975,1974,1973,1972,1971,1970,1969,1968,1967,1966,1965,1964,1963,1962,1961
This statistics in other country:
AfghanistanAlbaniaAlgeriaAmerican SamoaAndorraAngolaAntigua and BarbudaArab WorldArgentinaArmeniaArubaAustraliaAustriaAzerbaijanBahamas, TheBahrainBangladeshBarbadosBelarusBelgiumBelizeBeninBermudaBhutanBoliviaBosnia and HerzegovinaBotswanaBrazilBritish Virgin IslandsBrunei DarussalamBulgariaBurkina FasoBurundiCabo VerdeCambodiaCameroonCanadaCaribbean small statesCayman IslandsCentral African RepublicCentral Europe and the BalticsChadChannel IslandsChileChinaColombiaComorosCongo, Dem. Rep.Congo, Rep.Costa RicaCote d'IvoireCroatiaCubaCuracaoCyprusCzech RepublicDenmarkDjiboutiDominicaDominican RepublicEarly-demographic dividendEast Asia & PacificEast Asia & Pacific (excluding high income)East Asia & Pacific (IDA & IBRD countries)EcuadorEgypt, Arab Rep.El SalvadorEquatorial GuineaEritreaEstoniaEthiopiaEuro areaEurope & Central AsiaEurope & Central Asia (excluding high income)Europe & Central Asia (IDA & IBRD countries)European UnionFaroe IslandsFijiFinlandFragile and conflict affected situationsFranceFrench PolynesiaGabonGambia, TheGeorgiaGermanyGhanaGibraltarGreeceGreenlandGrenadaGuamGuatemalaGuineaGuinea-BissauGuyanaHaitiHeavily indebted poor countries (HIPC)High incomeHondurasHong Kong SAR, ChinaHungaryIBRD onlyIcelandIDA & IBRD totalIDA blendIDA onlyIDA totalIndiaIndonesiaIran, Islamic Rep.IraqIrelandIsle of ManIsraelItalyJamaicaJapanJordanKazakhstanKenyaKiribatiKorea, Dem. People’s Rep.Korea, Rep.KuwaitKyrgyz RepublicLao PDRLate-demographic dividendLatin America & Caribbean Latin America & Caribbean (excluding high income)Latin America & the Caribbean (IDA & IBRD countries)LatviaLeast developed countries: UN classificationLebanonLesothoLiberiaLibyaLiechtensteinLithuaniaLow & middle incomeLow incomeLower middle incomeLuxembourgMacao SAR, ChinaMacedonia, FYRMadagascarMalawiMalaysiaMaldivesMaliMaltaMarshall IslandsMauritaniaMauritiusMexicoMicronesia, Fed. Sts.Middle East & North AfricaMiddle East & North Africa (excluding high income)Middle East & North Africa (IDA & IBRD countries)Middle incomeMoldovaMonacoMongoliaMontenegroMoroccoMozambiqueMyanmarNamibiaNauruNepalNetherlandsNew CaledoniaNew ZealandNicaraguaNigerNigeriaNorth AmericaNorthern Mariana IslandsNorwayOECD membersOmanOther small statesPacific island small statesPakistanPalauPanamaPapua New GuineaParaguayPeruPhilippinesPolandPortugalPost-demographic dividendPre-demographic dividendPuerto RicoQatarRomaniaRussian FederationRwandaSamoaSan MarinoSao Tome and PrincipeSaudi ArabiaSenegalSerbiaSeychellesSierra LeoneSingaporeSint Maarten (Dutch part)Slovak RepublicSloveniaSmall statesSolomon IslandsSomaliaSouth AfricaSouth AsiaSouth Asia (IDA & IBRD)South SudanSpainSri LankaSt. Kitts and NevisSt. LuciaSt. Vincent and the GrenadinesSub-Saharan Africa Sub-Saharan Africa (excluding high income)Sub-Saharan Africa (IDA & IBRD countries)SudanSurinameSwazilandSwedenSwitzerlandSyrian Arab RepublicTajikistanTanzaniaThailandTimor-LesteTogoTongaTrinidad and TobagoTunisiaTurkeyTurkmenistanTurks and Caicos IslandsTuvaluUgandaUkraineUnited Arab EmiratesUnited KingdomUnited StatesUpper middle incomeUruguayUzbekistanVanuatuVenezuela, RBVietnamVirgin Islands (U.S.)West Bank and GazaWorldYemen, Rep.ZambiaZimbabwe Timeline:
This timeline shows a graph from 1961 to 2012 of Eritrea. No data until 1960. Number of actual observations by date: 52.
Source name:
World Development Indicators
Source organization:
World Bank Staff estimates based on United Nations, World Urbanization Prospects.
Categories, topics:
Agriculture & Rural Development
Last updated:
apr 23, 2017
Indicators value changes by year
Minimum:
79.046
jan 1, 2012
Maximum:
90.249
jan 1, 1961
At the date of observation
Value
Absolute change
Change from previous value
jan 1, 1961
90.249
+90.249
0.0%
jan 1, 1962
89.941
-0.308
-0.34%
jan 1, 1963
89.623
-0.318
-0.35%
jan 1, 1964
89.297
-0.326
-0.36%
jan 1, 1965
88.961
-0.336
-0.38%
jan 1, 1966
88.617
-0.344
-0.39%
jan 1, 1967
88.263
-0.354
-0.4%
jan 1, 1968
87.9
-0.363
-0.41%
jan 1, 1969
87.737
-0.163
-0.19%
jan 1, 1970
87.573
-0.164
-0.19%
jan 1, 1971
87.407
-0.166
-0.19%
jan 1, 1972
87.238
-0.169
-0.19%
jan 1, 1973
87.068
-0.17
-0.19%
jan 1, 1974
86.896
-0.172
-0.2%
jan 1, 1975
86.722
-0.174
-0.2%
jan 1, 1976
86.546
-0.176
-0.2%
jan 1, 1977
86.368
-0.178
-0.21%
jan 1, 1978
86.188
-0.18
-0.21%
jan 1, 1979
86.006
-0.182
-0.21%
jan 1, 1980
85.822
-0.184
-0.21%
jan 1, 1981
85.636
-0.186
-0.22%
jan 1, 1982
85.448
-0.188
-0.22%
jan 1, 1983
85.258
-0.19
-0.22%
jan 1, 1984
85.066
-0.192
-0.23%
jan 1, 1985
84.884
-0.182
-0.21%
jan 1, 1986
84.772
-0.112
-0.13%
jan 1, 1987
84.659
-0.113
-0.13%
jan 1, 1988
84.545
-0.114
-0.13%
jan 1, 1989
84.431
-0.114
-0.13%
jan 1, 1990
84.316
-0.115
-0.14%
jan 1, 1991
84.2
-0.116
-0.14%
jan 1, 1992
84.074
-0.126
-0.15%
jan 1, 1993
83.938
-0.136
-0.16%
jan 1, 1994
83.79
-0.148
-0.18%
jan 1, 1995
83.633
-0.157
-0.19%
jan 1, 1996
83.464
-0.169
-0.2%
jan 1, 1997
83.283
-0.181
-0.22%
jan 1, 1998
83.092
-0.191
-0.23%
jan 1, 1999
82.888
-0.204
-0.25%
jan 1, 2000
82.672
-0.216
-0.26%
jan 1, 2001
82.445
-0.227
-0.27%
jan 1, 2002
82.204
-0.241
-0.29%
jan 1, 2003
81.951
-0.253
-0.31%
jan 1, 2004
81.685
-0.266
-0.32%
jan 1, 2005
81.405
-0.28
-0.34%
jan 1, 2006
81.111
-0.294
-0.36%
jan 1, 2007
80.804
-0.307
-0.38%
jan 1, 2008
80.482
-0.322
-0.4%
jan 1, 2009
80.146
-0.336
-0.42%
jan 1, 2010
79.794
-0.352
-0.44%
jan 1, 2011
79.428
-0.366
-0.46%
jan 1, 2012
79.046
-0.382
-0.48%
Ranking of countries by current statistics by years


Comments: