29
/
en
AIzaSyAYiBZKx7MnpbEhh9jyipgxe19OcubqV5w
April 1, 2024
245041
Somalia
SOM
true
2
1
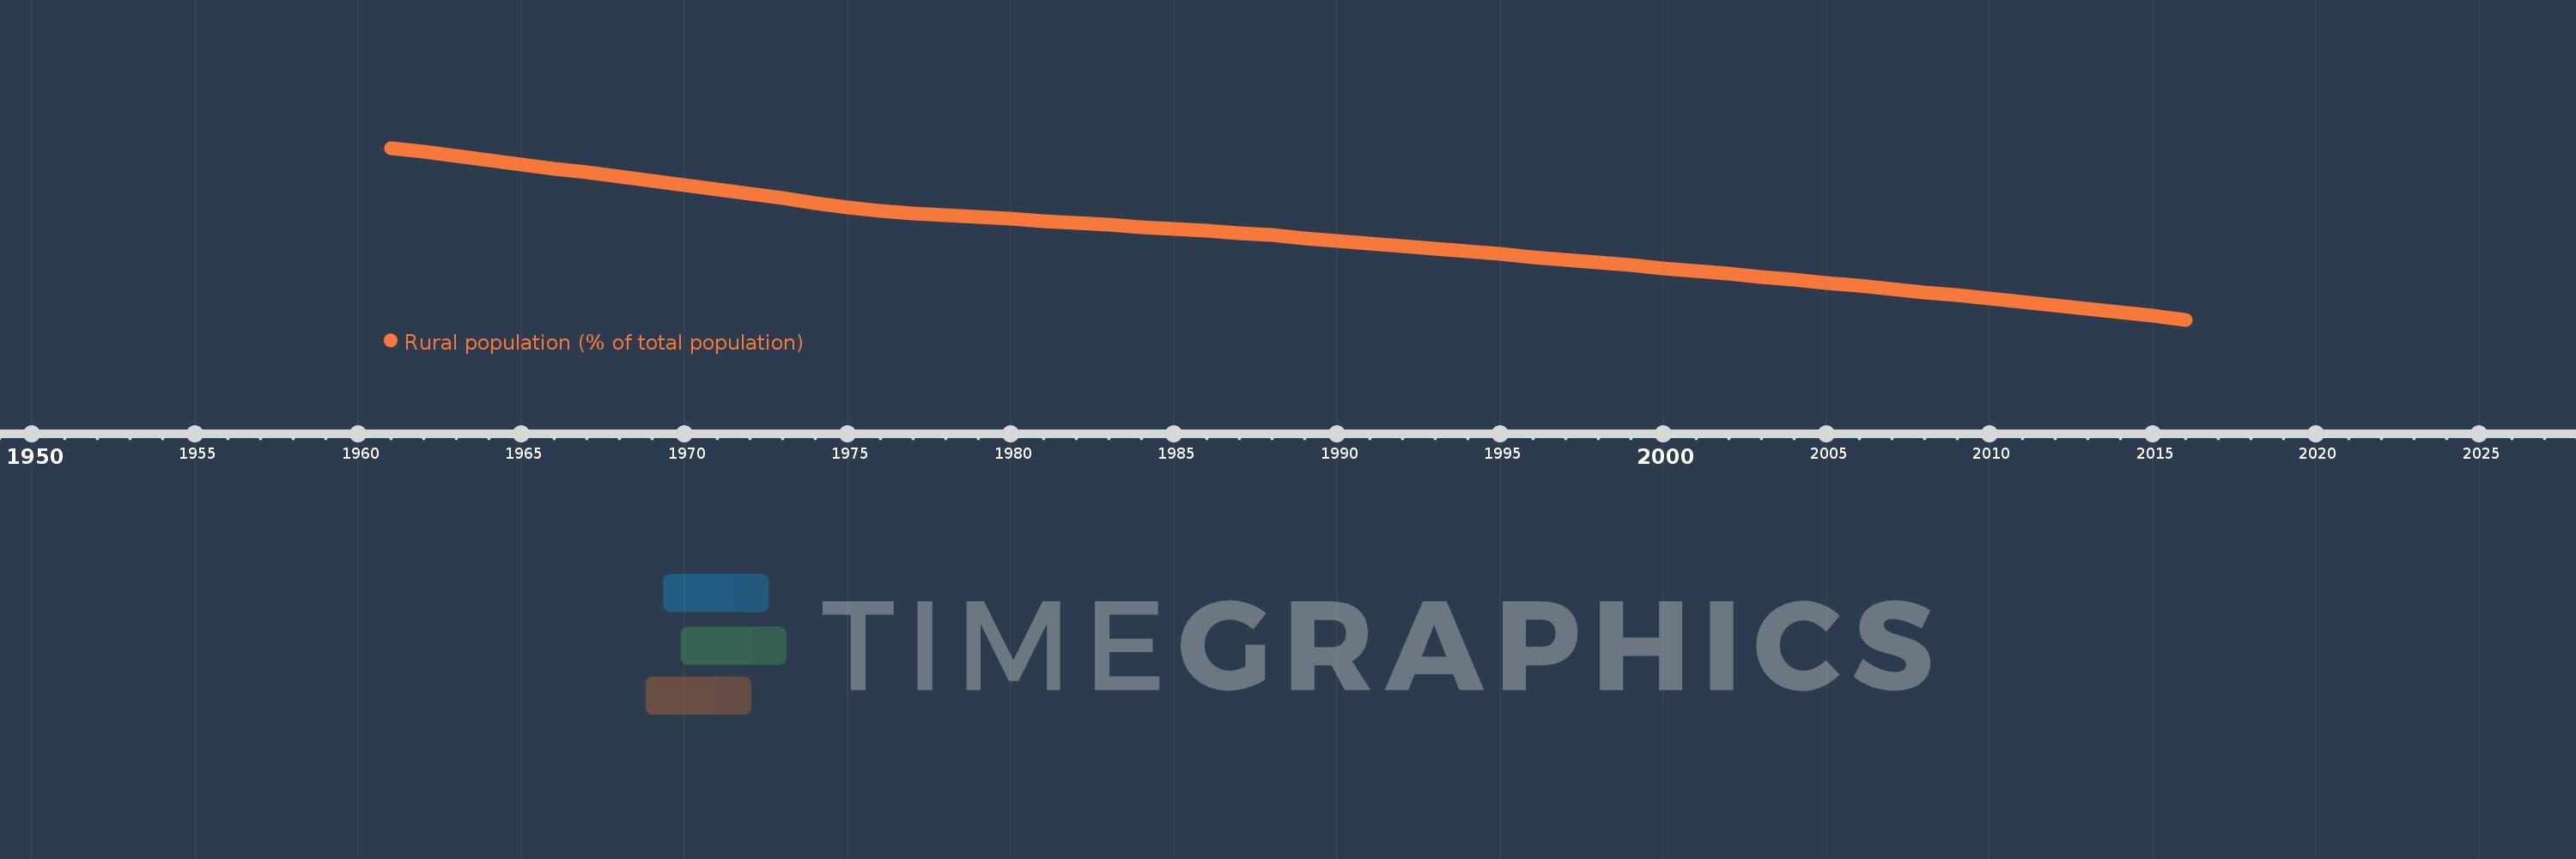
Rural population (% of total population)
2016,2015,2014,2013,2012,2011,2010,2009,2008,2007,2006,2005,2004,2003,2002,2001,2000,1999,1998,1997,1996,1995,1994,1993,1992,1991,1990,1989,1988,1987,1986,1985,1984,1983,1982,1981,1980,1979,1978,1977,1976,1975,1974,1973,1972,1971,1970,1969,1968,1967,1966,1965,1964,1963,1962,1961
This statistics in other country:
AfghanistanAlbaniaAlgeriaAmerican SamoaAndorraAngolaAntigua and BarbudaArab WorldArgentinaArmeniaArubaAustraliaAustriaAzerbaijanBahamas, TheBahrainBangladeshBarbadosBelarusBelgiumBelizeBeninBermudaBhutanBoliviaBosnia and HerzegovinaBotswanaBrazilBritish Virgin IslandsBrunei DarussalamBulgariaBurkina FasoBurundiCabo VerdeCambodiaCameroonCanadaCaribbean small statesCayman IslandsCentral African RepublicCentral Europe and the BalticsChadChannel IslandsChileChinaColombiaComorosCongo, Dem. Rep.Congo, Rep.Costa RicaCote d'IvoireCroatiaCubaCuracaoCyprusCzech RepublicDenmarkDjiboutiDominicaDominican RepublicEarly-demographic dividendEast Asia & PacificEast Asia & Pacific (excluding high income)East Asia & Pacific (IDA & IBRD countries)EcuadorEgypt, Arab Rep.El SalvadorEquatorial GuineaEritreaEstoniaEthiopiaEuro areaEurope & Central AsiaEurope & Central Asia (excluding high income)Europe & Central Asia (IDA & IBRD countries)European UnionFaroe IslandsFijiFinlandFragile and conflict affected situationsFranceFrench PolynesiaGabonGambia, TheGeorgiaGermanyGhanaGibraltarGreeceGreenlandGrenadaGuamGuatemalaGuineaGuinea-BissauGuyanaHaitiHeavily indebted poor countries (HIPC)High incomeHondurasHong Kong SAR, ChinaHungaryIBRD onlyIcelandIDA & IBRD totalIDA blendIDA onlyIDA totalIndiaIndonesiaIran, Islamic Rep.IraqIrelandIsle of ManIsraelItalyJamaicaJapanJordanKazakhstanKenyaKiribatiKorea, Dem. People’s Rep.Korea, Rep.KuwaitKyrgyz RepublicLao PDRLate-demographic dividendLatin America & Caribbean Latin America & Caribbean (excluding high income)Latin America & the Caribbean (IDA & IBRD countries)LatviaLeast developed countries: UN classificationLebanonLesothoLiberiaLibyaLiechtensteinLithuaniaLow & middle incomeLow incomeLower middle incomeLuxembourgMacao SAR, ChinaMacedonia, FYRMadagascarMalawiMalaysiaMaldivesMaliMaltaMarshall IslandsMauritaniaMauritiusMexicoMicronesia, Fed. Sts.Middle East & North AfricaMiddle East & North Africa (excluding high income)Middle East & North Africa (IDA & IBRD countries)Middle incomeMoldovaMonacoMongoliaMontenegroMoroccoMozambiqueMyanmarNamibiaNauruNepalNetherlandsNew CaledoniaNew ZealandNicaraguaNigerNigeriaNorth AmericaNorthern Mariana IslandsNorwayOECD membersOmanOther small statesPacific island small statesPakistanPalauPanamaPapua New GuineaParaguayPeruPhilippinesPolandPortugalPost-demographic dividendPre-demographic dividendPuerto RicoQatarRomaniaRussian FederationRwandaSamoaSan MarinoSao Tome and PrincipeSaudi ArabiaSenegalSerbiaSeychellesSierra LeoneSingaporeSint Maarten (Dutch part)Slovak RepublicSloveniaSmall statesSolomon IslandsSomaliaSouth AfricaSouth AsiaSouth Asia (IDA & IBRD)South SudanSpainSri LankaSt. Kitts and NevisSt. LuciaSt. Vincent and the GrenadinesSub-Saharan Africa Sub-Saharan Africa (excluding high income)Sub-Saharan Africa (IDA & IBRD countries)SudanSurinameSwazilandSwedenSwitzerlandSyrian Arab RepublicTajikistanTanzaniaThailandTimor-LesteTogoTongaTrinidad and TobagoTunisiaTurkeyTurkmenistanTurks and Caicos IslandsTuvaluUgandaUkraineUnited Arab EmiratesUnited KingdomUnited StatesUpper middle incomeUruguayUzbekistanVanuatuVenezuela, RBVietnamVirgin Islands (U.S.)West Bank and GazaWorldYemen, Rep.ZambiaZimbabwe Timeline:
This timeline shows a graph from 1961 to 2016 of Somalia. No data until 1960. Number of actual observations by date: 56.
Source name:
World Development Indicators
Source organization:
World Bank Staff estimates based on United Nations, World Urbanization Prospects.
Categories, topics:
Agriculture & Rural Development
Last updated:
apr 23, 2017
Indicators value changes by year
Minimum:
60.449
jan 1, 2016
Maximum:
82.688
jan 1, 1961
At the date of observation
Value
Absolute change
Change from previous value
jan 1, 1961
82.688
+82.688
0.0%
jan 1, 1962
82.165
-0.523
-0.63%
jan 1, 1963
81.628
-0.537
-0.65%
jan 1, 1964
81.08
-0.548
-0.67%
jan 1, 1965
80.547
-0.533
-0.66%
jan 1, 1966
80.036
-0.511
-0.63%
jan 1, 1967
79.513
-0.523
-0.65%
jan 1, 1968
78.98
-0.533
-0.67%
jan 1, 1969
78.437
-0.543
-0.69%
jan 1, 1970
77.885
-0.552
-0.7%
jan 1, 1971
77.322
-0.563
-0.72%
jan 1, 1972
76.749
-0.573
-0.74%
jan 1, 1973
76.165
-0.584
-0.76%
jan 1, 1974
75.573
-0.592
-0.78%
jan 1, 1975
74.97
-0.603
-0.8%
jan 1, 1976
74.502
-0.468
-0.62%
jan 1, 1977
74.252
-0.25
-0.34%
jan 1, 1978
74.001
-0.251
-0.34%
jan 1, 1979
73.748
-0.253
-0.34%
jan 1, 1980
73.493
-0.255
-0.35%
jan 1, 1981
73.237
-0.256
-0.35%
jan 1, 1982
72.979
-0.258
-0.35%
jan 1, 1983
72.72
-0.259
-0.35%
jan 1, 1984
72.459
-0.261
-0.36%
jan 1, 1985
72.196
-0.263
-0.36%
jan 1, 1986
71.933
-0.263
-0.36%
jan 1, 1987
71.667
-0.266
-0.37%
jan 1, 1988
71.373
-0.294
-0.41%
jan 1, 1989
71.031
-0.342
-0.48%
jan 1, 1990
70.688
-0.343
-0.48%
jan 1, 1991
70.342
-0.346
-0.49%
jan 1, 1992
69.993
-0.349
-0.5%
jan 1, 1993
69.641
-0.352
-0.5%
jan 1, 1994
69.289
-0.352
-0.51%
jan 1, 1995
68.933
-0.356
-0.51%
jan 1, 1996
68.575
-0.358
-0.52%
jan 1, 1997
68.215
-0.36
-0.52%
jan 1, 1998
67.853
-0.362
-0.53%
jan 1, 1999
67.489
-0.364
-0.54%
jan 1, 2000
67.122
-0.367
-0.54%
jan 1, 2001
66.753
-0.369
-0.55%
jan 1, 2002
66.383
-0.37
-0.55%
jan 1, 2003
66.01
-0.373
-0.56%
jan 1, 2004
65.629
-0.381
-0.58%
jan 1, 2005
65.24
-0.389
-0.59%
jan 1, 2006
64.844
-0.396
-0.61%
jan 1, 2007
64.439
-0.405
-0.62%
jan 1, 2008
64.026
-0.413
-0.64%
jan 1, 2009
63.606
-0.42
-0.66%
jan 1, 2010
63.177
-0.429
-0.67%
jan 1, 2011
62.741
-0.436
-0.69%
jan 1, 2012
62.298
-0.443
-0.71%
jan 1, 2013
61.847
-0.451
-0.72%
jan 1, 2014
61.388
-0.459
-0.74%
jan 1, 2015
60.922
-0.466
-0.76%
jan 1, 2016
60.449
-0.473
-0.78%
Ranking of countries by current statistics by years


Comments: