29
/
en
AIzaSyAYiBZKx7MnpbEhh9jyipgxe19OcubqV5w
April 1, 2024
200984
Montenegro
MNE
true
2
1
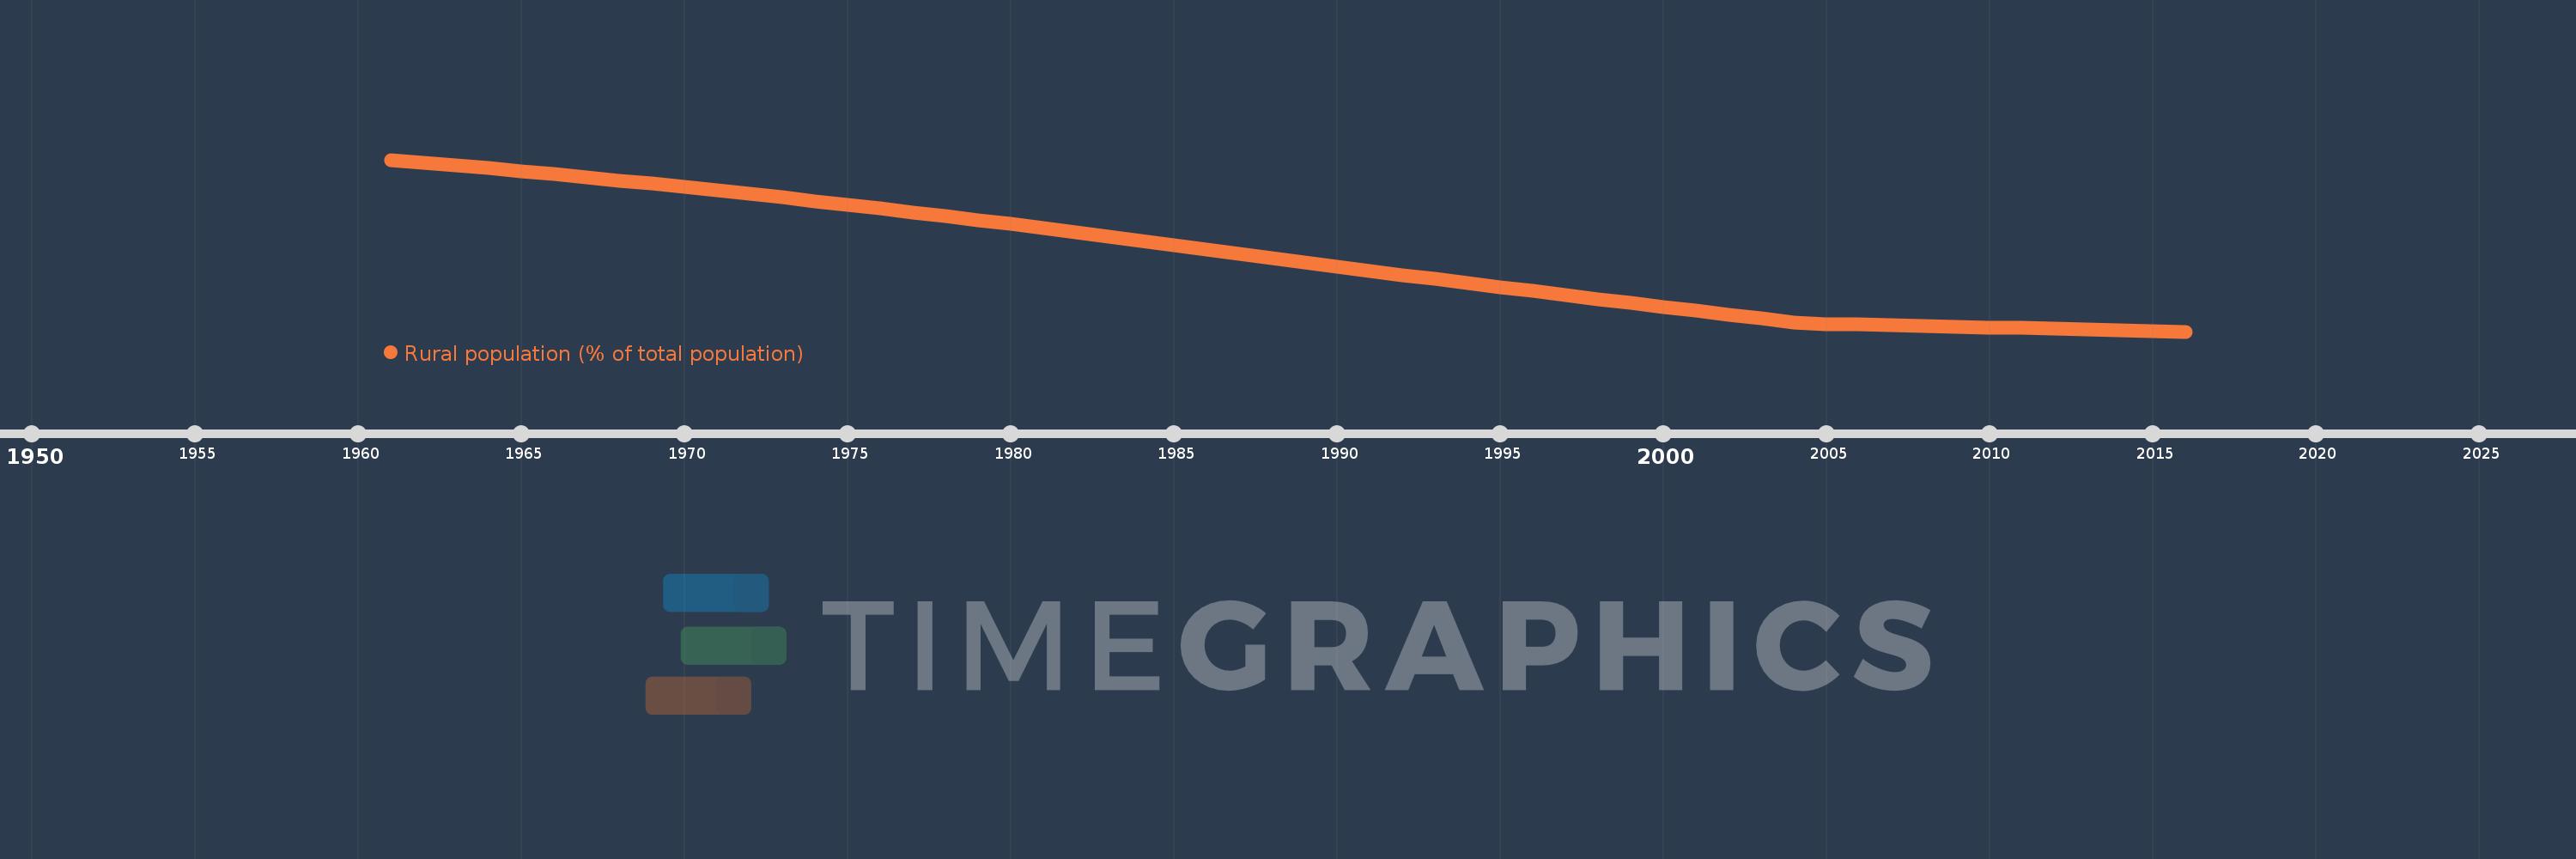
Rural population (% of total population)
2016,2015,2014,2013,2012,2011,2010,2009,2008,2007,2006,2005,2004,2003,2002,2001,2000,1999,1998,1997,1996,1995,1994,1993,1992,1991,1990,1989,1988,1987,1986,1985,1984,1983,1982,1981,1980,1979,1978,1977,1976,1975,1974,1973,1972,1971,1970,1969,1968,1967,1966,1965,1964,1963,1962,1961
This statistics in other country:
AfghanistanAlbaniaAlgeriaAmerican SamoaAndorraAngolaAntigua and BarbudaArab WorldArgentinaArmeniaArubaAustraliaAustriaAzerbaijanBahamas, TheBahrainBangladeshBarbadosBelarusBelgiumBelizeBeninBermudaBhutanBoliviaBosnia and HerzegovinaBotswanaBrazilBritish Virgin IslandsBrunei DarussalamBulgariaBurkina FasoBurundiCabo VerdeCambodiaCameroonCanadaCaribbean small statesCayman IslandsCentral African RepublicCentral Europe and the BalticsChadChannel IslandsChileChinaColombiaComorosCongo, Dem. Rep.Congo, Rep.Costa RicaCote d'IvoireCroatiaCubaCuracaoCyprusCzech RepublicDenmarkDjiboutiDominicaDominican RepublicEarly-demographic dividendEast Asia & PacificEast Asia & Pacific (excluding high income)East Asia & Pacific (IDA & IBRD countries)EcuadorEgypt, Arab Rep.El SalvadorEquatorial GuineaEritreaEstoniaEthiopiaEuro areaEurope & Central AsiaEurope & Central Asia (excluding high income)Europe & Central Asia (IDA & IBRD countries)European UnionFaroe IslandsFijiFinlandFragile and conflict affected situationsFranceFrench PolynesiaGabonGambia, TheGeorgiaGermanyGhanaGibraltarGreeceGreenlandGrenadaGuamGuatemalaGuineaGuinea-BissauGuyanaHaitiHeavily indebted poor countries (HIPC)High incomeHondurasHong Kong SAR, ChinaHungaryIBRD onlyIcelandIDA & IBRD totalIDA blendIDA onlyIDA totalIndiaIndonesiaIran, Islamic Rep.IraqIrelandIsle of ManIsraelItalyJamaicaJapanJordanKazakhstanKenyaKiribatiKorea, Dem. People’s Rep.Korea, Rep.KuwaitKyrgyz RepublicLao PDRLate-demographic dividendLatin America & Caribbean Latin America & Caribbean (excluding high income)Latin America & the Caribbean (IDA & IBRD countries)LatviaLeast developed countries: UN classificationLebanonLesothoLiberiaLibyaLiechtensteinLithuaniaLow & middle incomeLow incomeLower middle incomeLuxembourgMacao SAR, ChinaMacedonia, FYRMadagascarMalawiMalaysiaMaldivesMaliMaltaMarshall IslandsMauritaniaMauritiusMexicoMicronesia, Fed. Sts.Middle East & North AfricaMiddle East & North Africa (excluding high income)Middle East & North Africa (IDA & IBRD countries)Middle incomeMoldovaMonacoMongoliaMontenegroMoroccoMozambiqueMyanmarNamibiaNauruNepalNetherlandsNew CaledoniaNew ZealandNicaraguaNigerNigeriaNorth AmericaNorthern Mariana IslandsNorwayOECD membersOmanOther small statesPacific island small statesPakistanPalauPanamaPapua New GuineaParaguayPeruPhilippinesPolandPortugalPost-demographic dividendPre-demographic dividendPuerto RicoQatarRomaniaRussian FederationRwandaSamoaSan MarinoSao Tome and PrincipeSaudi ArabiaSenegalSerbiaSeychellesSierra LeoneSingaporeSint Maarten (Dutch part)Slovak RepublicSloveniaSmall statesSolomon IslandsSomaliaSouth AfricaSouth AsiaSouth Asia (IDA & IBRD)South SudanSpainSri LankaSt. Kitts and NevisSt. LuciaSt. Vincent and the GrenadinesSub-Saharan Africa Sub-Saharan Africa (excluding high income)Sub-Saharan Africa (IDA & IBRD countries)SudanSurinameSwazilandSwedenSwitzerlandSyrian Arab RepublicTajikistanTanzaniaThailandTimor-LesteTogoTongaTrinidad and TobagoTunisiaTurkeyTurkmenistanTurks and Caicos IslandsTuvaluUgandaUkraineUnited Arab EmiratesUnited KingdomUnited StatesUpper middle incomeUruguayUzbekistanVanuatuVenezuela, RBVietnamVirgin Islands (U.S.)West Bank and GazaWorldYemen, Rep.ZambiaZimbabwe Timeline:
This timeline shows a graph from 1961 to 2016 of Montenegro. No data until 1960. Number of actual observations by date: 56.
Source name:
World Development Indicators
Source organization:
World Bank Staff estimates based on United Nations, World Urbanization Prospects.
Categories, topics:
Agriculture & Rural Development
Last updated:
apr 23, 2017
Indicators value changes by year
Minimum:
35.974
jan 1, 2016
Maximum:
81.212
jan 1, 1961
At the date of observation
Value
Absolute change
Change from previous value
jan 1, 1961
81.212
+81.212
0.0%
jan 1, 1962
80.498
-0.714
-0.88%
jan 1, 1963
79.763
-0.735
-0.91%
jan 1, 1964
79.007
-0.756
-0.95%
jan 1, 1965
78.23
-0.777
-0.98%
jan 1, 1966
77.434
-0.796
-1.02%
jan 1, 1967
76.617
-0.817
-1.06%
jan 1, 1968
75.78
-0.837
-1.09%
jan 1, 1969
74.921
-0.859
-1.13%
jan 1, 1970
74.045
-0.876
-1.17%
jan 1, 1971
73.147
-0.898
-1.21%
jan 1, 1972
72.231
-0.916
-1.25%
jan 1, 1973
71.294
-0.937
-1.3%
jan 1, 1974
70.341
-0.953
-1.34%
jan 1, 1975
69.368
-0.973
-1.38%
jan 1, 1976
68.378
-0.99
-1.43%
jan 1, 1977
67.37
-1.008
-1.47%
jan 1, 1978
66.348
-1.022
-1.52%
jan 1, 1979
65.31
-1.038
-1.56%
jan 1, 1980
64.256
-1.054
-1.61%
jan 1, 1981
63.187
-1.069
-1.66%
jan 1, 1982
62.108
-1.079
-1.71%
jan 1, 1983
61.016
-1.092
-1.76%
jan 1, 1984
59.912
-1.104
-1.81%
jan 1, 1985
58.796
-1.116
-1.86%
jan 1, 1986
57.675
-1.121
-1.91%
jan 1, 1987
56.544
-1.131
-1.96%
jan 1, 1988
55.406
-1.138
-2.01%
jan 1, 1989
54.261
-1.145
-2.07%
jan 1, 1990
53.114
-1.147
-2.11%
jan 1, 1991
51.963
-1.151
-2.17%
jan 1, 1992
50.835
-1.128
-2.17%
jan 1, 1993
49.782
-1.053
-2.07%
jan 1, 1994
48.733
-1.049
-2.11%
jan 1, 1995
47.683
-1.05
-2.15%
jan 1, 1996
46.635
-1.048
-2.2%
jan 1, 1997
45.588
-1.047
-2.25%
jan 1, 1998
44.549
-1.039
-2.28%
jan 1, 1999
43.512
-1.037
-2.33%
jan 1, 2000
42.482
-1.03
-2.37%
jan 1, 2001
41.456
-1.026
-2.42%
jan 1, 2002
40.441
-1.015
-2.45%
jan 1, 2003
39.432
-1.009
-2.49%
jan 1, 2004
38.432
-1.0
-2.54%
jan 1, 2005
37.98
-0.452
-1.18%
jan 1, 2006
37.8
-0.18
-0.47%
jan 1, 2007
37.62
-0.18
-0.48%
jan 1, 2008
37.44
-0.18
-0.48%
jan 1, 2009
37.261
-0.179
-0.48%
jan 1, 2010
37.082
-0.179
-0.48%
jan 1, 2011
36.904
-0.178
-0.48%
jan 1, 2012
36.726
-0.178
-0.48%
jan 1, 2013
36.543
-0.183
-0.5%
jan 1, 2014
36.357
-0.186
-0.51%
jan 1, 2015
36.168
-0.189
-0.52%
jan 1, 2016
35.974
-0.194
-0.54%
Ranking of countries by current statistics by years


Comments: