29
/
en
AIzaSyAYiBZKx7MnpbEhh9jyipgxe19OcubqV5w
April 1, 2024
227850
Qatar
QAT
true
2
1
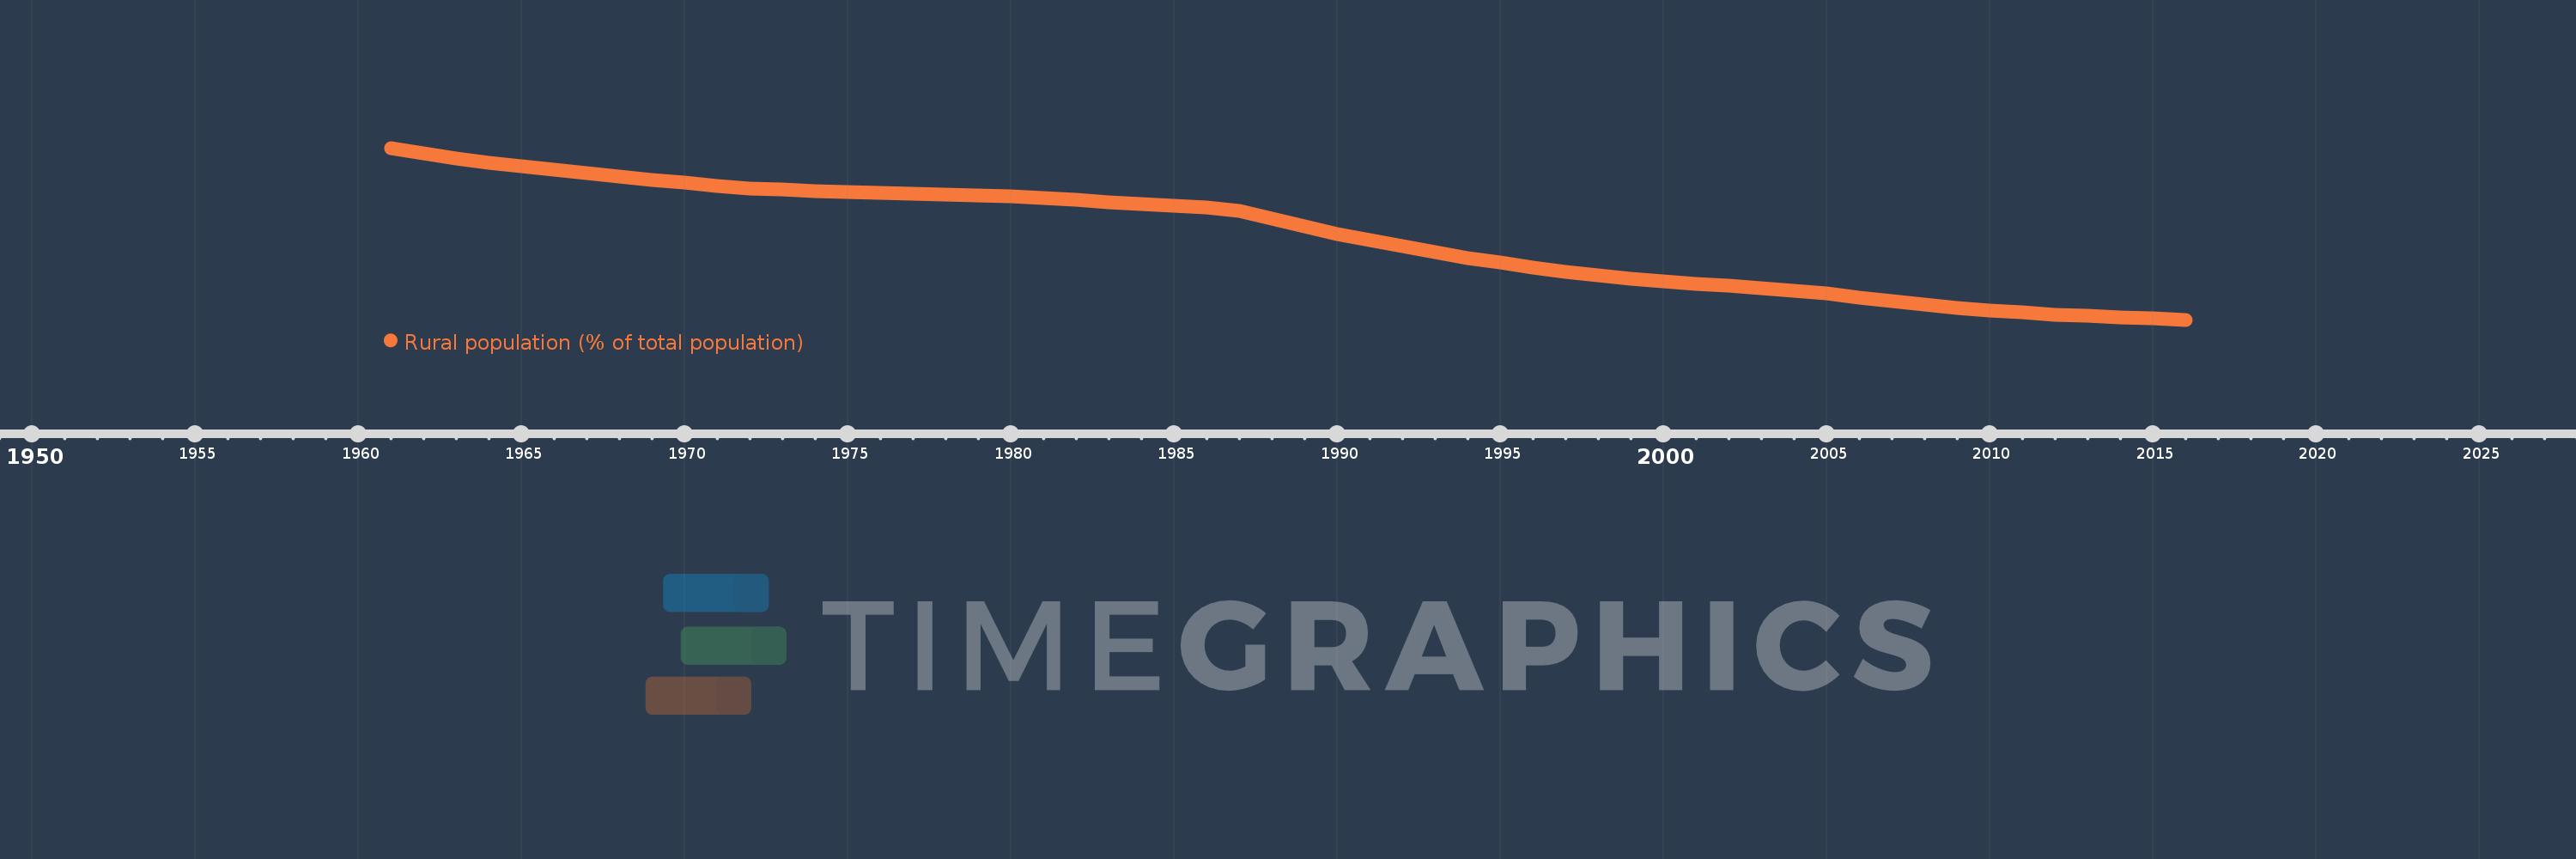
Rural population (% of total population)
2016,2015,2014,2013,2012,2011,2010,2009,2008,2007,2006,2005,2004,2003,2002,2001,2000,1999,1998,1997,1996,1995,1994,1993,1992,1991,1990,1989,1988,1987,1986,1985,1984,1983,1982,1981,1980,1979,1978,1977,1976,1975,1974,1973,1972,1971,1970,1969,1968,1967,1966,1965,1964,1963,1962,1961
This statistics in other country:
AfghanistanAlbaniaAlgeriaAmerican SamoaAndorraAngolaAntigua and BarbudaArab WorldArgentinaArmeniaArubaAustraliaAustriaAzerbaijanBahamas, TheBahrainBangladeshBarbadosBelarusBelgiumBelizeBeninBermudaBhutanBoliviaBosnia and HerzegovinaBotswanaBrazilBritish Virgin IslandsBrunei DarussalamBulgariaBurkina FasoBurundiCabo VerdeCambodiaCameroonCanadaCaribbean small statesCayman IslandsCentral African RepublicCentral Europe and the BalticsChadChannel IslandsChileChinaColombiaComorosCongo, Dem. Rep.Congo, Rep.Costa RicaCote d'IvoireCroatiaCubaCuracaoCyprusCzech RepublicDenmarkDjiboutiDominicaDominican RepublicEarly-demographic dividendEast Asia & PacificEast Asia & Pacific (excluding high income)East Asia & Pacific (IDA & IBRD countries)EcuadorEgypt, Arab Rep.El SalvadorEquatorial GuineaEritreaEstoniaEthiopiaEuro areaEurope & Central AsiaEurope & Central Asia (excluding high income)Europe & Central Asia (IDA & IBRD countries)European UnionFaroe IslandsFijiFinlandFragile and conflict affected situationsFranceFrench PolynesiaGabonGambia, TheGeorgiaGermanyGhanaGibraltarGreeceGreenlandGrenadaGuamGuatemalaGuineaGuinea-BissauGuyanaHaitiHeavily indebted poor countries (HIPC)High incomeHondurasHong Kong SAR, ChinaHungaryIBRD onlyIcelandIDA & IBRD totalIDA blendIDA onlyIDA totalIndiaIndonesiaIran, Islamic Rep.IraqIrelandIsle of ManIsraelItalyJamaicaJapanJordanKazakhstanKenyaKiribatiKorea, Dem. People’s Rep.Korea, Rep.KuwaitKyrgyz RepublicLao PDRLate-demographic dividendLatin America & Caribbean Latin America & Caribbean (excluding high income)Latin America & the Caribbean (IDA & IBRD countries)LatviaLeast developed countries: UN classificationLebanonLesothoLiberiaLibyaLiechtensteinLithuaniaLow & middle incomeLow incomeLower middle incomeLuxembourgMacao SAR, ChinaMacedonia, FYRMadagascarMalawiMalaysiaMaldivesMaliMaltaMarshall IslandsMauritaniaMauritiusMexicoMicronesia, Fed. Sts.Middle East & North AfricaMiddle East & North Africa (excluding high income)Middle East & North Africa (IDA & IBRD countries)Middle incomeMoldovaMonacoMongoliaMontenegroMoroccoMozambiqueMyanmarNamibiaNauruNepalNetherlandsNew CaledoniaNew ZealandNicaraguaNigerNigeriaNorth AmericaNorthern Mariana IslandsNorwayOECD membersOmanOther small statesPacific island small statesPakistanPalauPanamaPapua New GuineaParaguayPeruPhilippinesPolandPortugalPost-demographic dividendPre-demographic dividendPuerto RicoQatarRomaniaRussian FederationRwandaSamoaSan MarinoSao Tome and PrincipeSaudi ArabiaSenegalSerbiaSeychellesSierra LeoneSingaporeSint Maarten (Dutch part)Slovak RepublicSloveniaSmall statesSolomon IslandsSomaliaSouth AfricaSouth AsiaSouth Asia (IDA & IBRD)South SudanSpainSri LankaSt. Kitts and NevisSt. LuciaSt. Vincent and the GrenadinesSub-Saharan Africa Sub-Saharan Africa (excluding high income)Sub-Saharan Africa (IDA & IBRD countries)SudanSurinameSwazilandSwedenSwitzerlandSyrian Arab RepublicTajikistanTanzaniaThailandTimor-LesteTogoTongaTrinidad and TobagoTunisiaTurkeyTurkmenistanTurks and Caicos IslandsTuvaluUgandaUkraineUnited Arab EmiratesUnited KingdomUnited StatesUpper middle incomeUruguayUzbekistanVanuatuVenezuela, RBVietnamVirgin Islands (U.S.)West Bank and GazaWorldYemen, Rep.ZambiaZimbabwe Timeline:
This timeline shows a graph from 1961 to 2016 of Qatar. No data until 1960. Number of actual observations by date: 56.
Source name:
World Development Indicators
Source organization:
World Bank Staff estimates based on United Nations, World Urbanization Prospects.
Categories, topics:
Agriculture & Rural Development
Last updated:
apr 23, 2017
Indicators value changes by year
Maximum:
14.725
jan 1, 1961
At the date of observation
Value
Absolute change
Change from previous value
jan 1, 1961
14.725
+14.725
0.0%
jan 1, 1962
14.307
-0.418
-2.84%
jan 1, 1963
13.899
-0.408
-2.85%
jan 1, 1964
13.5
-0.399
-2.87%
jan 1, 1965
13.22
-0.28
-2.07%
jan 1, 1966
12.946
-0.274
-2.07%
jan 1, 1967
12.677
-0.269
-2.08%
jan 1, 1968
12.412
-0.265
-2.09%
jan 1, 1969
12.152
-0.26
-2.09%
jan 1, 1970
11.897
-0.255
-2.1%
jan 1, 1971
11.646
-0.251
-2.11%
jan 1, 1972
11.4
-0.246
-2.11%
jan 1, 1973
11.322
-0.078
-0.68%
jan 1, 1974
11.245
-0.077
-0.68%
jan 1, 1975
11.168
-0.077
-0.68%
jan 1, 1976
11.091
-0.077
-0.69%
jan 1, 1977
11.015
-0.076
-0.69%
jan 1, 1978
10.94
-0.075
-0.68%
jan 1, 1979
10.865
-0.075
-0.69%
jan 1, 1980
10.79
-0.075
-0.69%
jan 1, 1981
10.637
-0.153
-1.42%
jan 1, 1982
10.486
-0.151
-1.42%
jan 1, 1983
10.337
-0.149
-1.42%
jan 1, 1984
10.189
-0.148
-1.43%
jan 1, 1985
10.044
-0.145
-1.42%
jan 1, 1986
9.9
-0.144
-1.43%
jan 1, 1987
9.6
-0.3
-3.03%
jan 1, 1988
8.944
-0.656
-6.83%
jan 1, 1989
8.329
-0.615
-6.88%
jan 1, 1990
7.753
-0.576
-6.92%
jan 1, 1991
7.214
-0.539
-6.95%
jan 1, 1992
6.709
-0.505
-7.0%
jan 1, 1993
6.237
-0.472
-7.04%
jan 1, 1994
5.797
-0.44
-7.05%
jan 1, 1995
5.386
-0.411
-7.09%
jan 1, 1996
5.002
-0.384
-7.13%
jan 1, 1997
4.644
-0.358
-7.16%
jan 1, 1998
4.341
-0.303
-6.52%
jan 1, 1999
4.112
-0.229
-5.28%
jan 1, 2000
3.895
-0.217
-5.28%
jan 1, 2001
3.689
-0.206
-5.29%
jan 1, 2002
3.494
-0.195
-5.29%
jan 1, 2003
3.308
-0.186
-5.32%
jan 1, 2004
3.132
-0.176
-5.32%
jan 1, 2005
2.895
-0.237
-7.57%
jan 1, 2006
2.551
-0.344
-11.88%
jan 1, 2007
2.246
-0.305
-11.96%
jan 1, 2008
1.977
-0.269
-11.98%
jan 1, 2009
1.739
-0.238
-12.04%
jan 1, 2010
1.53
-0.209
-12.02%
jan 1, 2011
1.345
-0.185
-12.09%
jan 1, 2012
1.188
-0.157
-11.67%
jan 1, 2013
1.054
-0.134
-11.28%
jan 1, 2014
0.939
-0.115
-10.91%
jan 1, 2015
0.841
-0.098
-10.44%
jan 1, 2016
0.756
-0.085
-10.11%
Ranking of countries by current statistics by years


Comments: