29
/
en
AIzaSyAYiBZKx7MnpbEhh9jyipgxe19OcubqV5w
April 1, 2024
133597
Finland
FIN
true
2
1
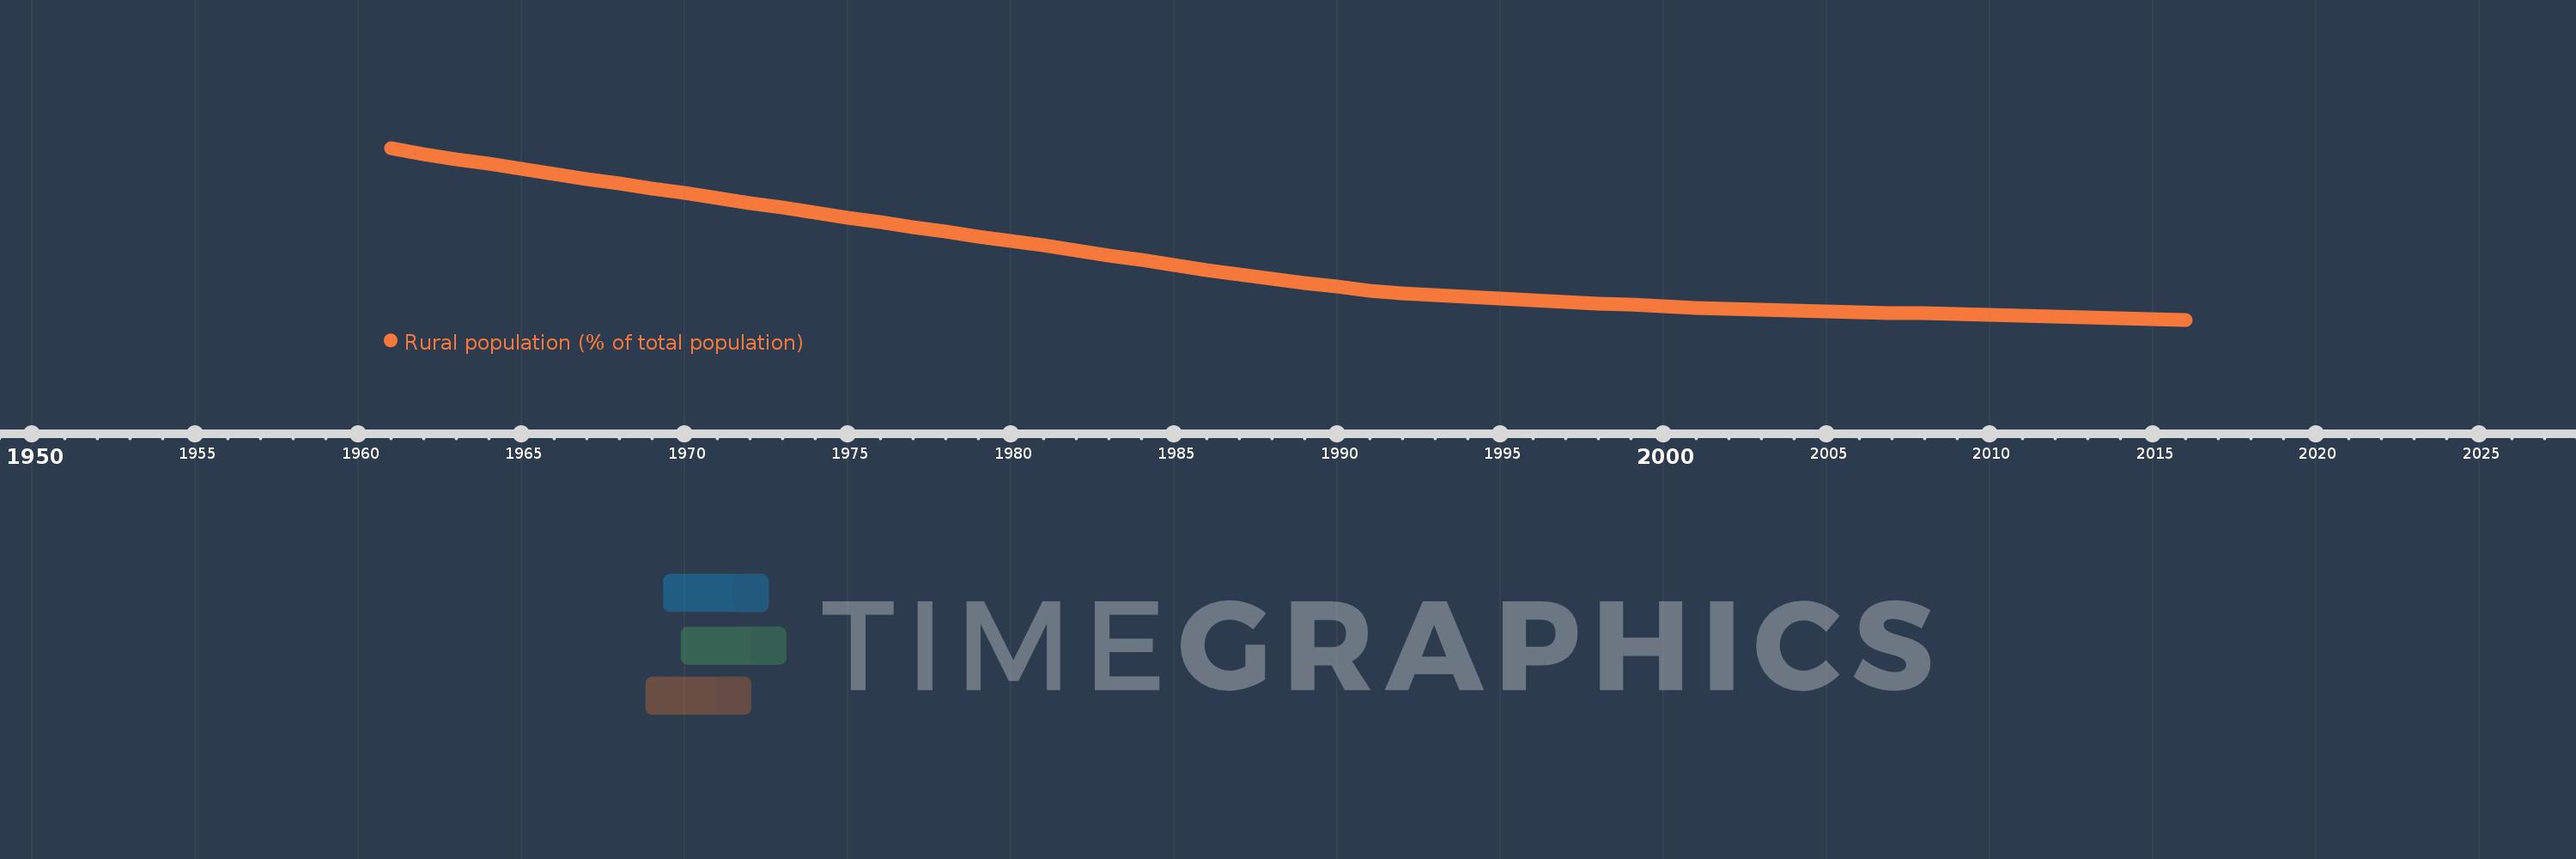
Rural population (% of total population)
2016,2015,2014,2013,2012,2011,2010,2009,2008,2007,2006,2005,2004,2003,2002,2001,2000,1999,1998,1997,1996,1995,1994,1993,1992,1991,1990,1989,1988,1987,1986,1985,1984,1983,1982,1981,1980,1979,1978,1977,1976,1975,1974,1973,1972,1971,1970,1969,1968,1967,1966,1965,1964,1963,1962,1961
This statistics in other country:
AfghanistanAlbaniaAlgeriaAmerican SamoaAndorraAngolaAntigua and BarbudaArab WorldArgentinaArmeniaArubaAustraliaAustriaAzerbaijanBahamas, TheBahrainBangladeshBarbadosBelarusBelgiumBelizeBeninBermudaBhutanBoliviaBosnia and HerzegovinaBotswanaBrazilBritish Virgin IslandsBrunei DarussalamBulgariaBurkina FasoBurundiCabo VerdeCambodiaCameroonCanadaCaribbean small statesCayman IslandsCentral African RepublicCentral Europe and the BalticsChadChannel IslandsChileChinaColombiaComorosCongo, Dem. Rep.Congo, Rep.Costa RicaCote d'IvoireCroatiaCubaCuracaoCyprusCzech RepublicDenmarkDjiboutiDominicaDominican RepublicEarly-demographic dividendEast Asia & PacificEast Asia & Pacific (excluding high income)East Asia & Pacific (IDA & IBRD countries)EcuadorEgypt, Arab Rep.El SalvadorEquatorial GuineaEritreaEstoniaEthiopiaEuro areaEurope & Central AsiaEurope & Central Asia (excluding high income)Europe & Central Asia (IDA & IBRD countries)European UnionFaroe IslandsFijiFinlandFragile and conflict affected situationsFranceFrench PolynesiaGabonGambia, TheGeorgiaGermanyGhanaGibraltarGreeceGreenlandGrenadaGuamGuatemalaGuineaGuinea-BissauGuyanaHaitiHeavily indebted poor countries (HIPC)High incomeHondurasHong Kong SAR, ChinaHungaryIBRD onlyIcelandIDA & IBRD totalIDA blendIDA onlyIDA totalIndiaIndonesiaIran, Islamic Rep.IraqIrelandIsle of ManIsraelItalyJamaicaJapanJordanKazakhstanKenyaKiribatiKorea, Dem. People’s Rep.Korea, Rep.KuwaitKyrgyz RepublicLao PDRLate-demographic dividendLatin America & Caribbean Latin America & Caribbean (excluding high income)Latin America & the Caribbean (IDA & IBRD countries)LatviaLeast developed countries: UN classificationLebanonLesothoLiberiaLibyaLiechtensteinLithuaniaLow & middle incomeLow incomeLower middle incomeLuxembourgMacao SAR, ChinaMacedonia, FYRMadagascarMalawiMalaysiaMaldivesMaliMaltaMarshall IslandsMauritaniaMauritiusMexicoMicronesia, Fed. Sts.Middle East & North AfricaMiddle East & North Africa (excluding high income)Middle East & North Africa (IDA & IBRD countries)Middle incomeMoldovaMonacoMongoliaMontenegroMoroccoMozambiqueMyanmarNamibiaNauruNepalNetherlandsNew CaledoniaNew ZealandNicaraguaNigerNigeriaNorth AmericaNorthern Mariana IslandsNorwayOECD membersOmanOther small statesPacific island small statesPakistanPalauPanamaPapua New GuineaParaguayPeruPhilippinesPolandPortugalPost-demographic dividendPre-demographic dividendPuerto RicoQatarRomaniaRussian FederationRwandaSamoaSan MarinoSao Tome and PrincipeSaudi ArabiaSenegalSerbiaSeychellesSierra LeoneSingaporeSint Maarten (Dutch part)Slovak RepublicSloveniaSmall statesSolomon IslandsSomaliaSouth AfricaSouth AsiaSouth Asia (IDA & IBRD)South SudanSpainSri LankaSt. Kitts and NevisSt. LuciaSt. Vincent and the GrenadinesSub-Saharan Africa Sub-Saharan Africa (excluding high income)Sub-Saharan Africa (IDA & IBRD countries)SudanSurinameSwazilandSwedenSwitzerlandSyrian Arab RepublicTajikistanTanzaniaThailandTimor-LesteTogoTongaTrinidad and TobagoTunisiaTurkeyTurkmenistanTurks and Caicos IslandsTuvaluUgandaUkraineUnited Arab EmiratesUnited KingdomUnited StatesUpper middle incomeUruguayUzbekistanVanuatuVenezuela, RBVietnamVirgin Islands (U.S.)West Bank and GazaWorldYemen, Rep.ZambiaZimbabwe Timeline:
This timeline shows a graph from 1961 to 2016 of Finland. No data until 1960. Number of actual observations by date: 56.
Source name:
World Development Indicators
Source organization:
World Bank Staff estimates based on United Nations, World Urbanization Prospects.
Categories, topics:
Agriculture & Rural Development
Last updated:
apr 23, 2017
Indicators value changes by year
Minimum:
15.779
jan 1, 2016
At the date of observation
Value
Absolute change
Change from previous value
jan 1, 1961
44.71
+44.71
0.0%
jan 1, 1962
43.679
-1.031
-2.31%
jan 1, 1963
42.838
-0.841
-1.93%
jan 1, 1964
42.002
-0.836
-1.95%
jan 1, 1965
41.168
-0.834
-1.99%
jan 1, 1966
40.342
-0.826
-2.01%
jan 1, 1967
39.52
-0.822
-2.04%
jan 1, 1968
38.705
-0.815
-2.06%
jan 1, 1969
37.894
-0.811
-2.1%
jan 1, 1970
37.092
-0.802
-2.12%
jan 1, 1971
36.296
-0.796
-2.15%
jan 1, 1972
35.477
-0.819
-2.26%
jan 1, 1973
34.634
-0.843
-2.38%
jan 1, 1974
33.803
-0.831
-2.4%
jan 1, 1975
32.981
-0.822
-2.43%
jan 1, 1976
32.169
-0.812
-2.46%
jan 1, 1977
31.366
-0.803
-2.5%
jan 1, 1978
30.577
-0.789
-2.52%
jan 1, 1979
29.798
-0.779
-2.55%
jan 1, 1980
29.03
-0.768
-2.58%
jan 1, 1981
28.273
-0.757
-2.61%
jan 1, 1982
27.472
-0.801
-2.83%
jan 1, 1983
26.627
-0.845
-3.08%
jan 1, 1984
25.798
-0.829
-3.11%
jan 1, 1985
24.985
-0.813
-3.15%
jan 1, 1986
24.192
-0.793
-3.17%
jan 1, 1987
23.433
-0.759
-3.14%
jan 1, 1988
22.709
-0.724
-3.09%
jan 1, 1989
22.0
-0.709
-3.12%
jan 1, 1990
21.309
-0.691
-3.14%
jan 1, 1991
20.633
-0.676
-3.17%
jan 1, 1992
20.157
-0.476
-2.31%
jan 1, 1993
19.872
-0.285
-1.41%
jan 1, 1994
19.591
-0.281
-1.41%
jan 1, 1995
19.312
-0.279
-1.42%
jan 1, 1996
19.037
-0.275
-1.42%
jan 1, 1997
18.777
-0.26
-1.37%
jan 1, 1998
18.534
-0.243
-1.29%
jan 1, 1999
18.293
-0.241
-1.3%
jan 1, 2000
18.054
-0.239
-1.31%
jan 1, 2001
17.817
-0.237
-1.31%
jan 1, 2002
17.632
-0.185
-1.04%
jan 1, 2003
17.497
-0.135
-0.77%
jan 1, 2004
17.362
-0.135
-0.77%
jan 1, 2005
17.228
-0.134
-0.77%
jan 1, 2006
17.095
-0.133
-0.77%
jan 1, 2007
16.963
-0.132
-0.77%
jan 1, 2008
16.832
-0.131
-0.77%
jan 1, 2009
16.701
-0.131
-0.78%
jan 1, 2010
16.571
-0.13
-0.78%
jan 1, 2011
16.442
-0.129
-0.78%
jan 1, 2012
16.312
-0.13
-0.79%
jan 1, 2013
16.181
-0.131
-0.8%
jan 1, 2014
16.048
-0.133
-0.82%
jan 1, 2015
15.914
-0.134
-0.83%
jan 1, 2016
15.779
-0.135
-0.85%
Ranking of countries by current statistics by years


Comments: