29
/
en
AIzaSyAYiBZKx7MnpbEhh9jyipgxe19OcubqV5w
April 1, 2024
243094
Slovenia
SVN
true
2
1
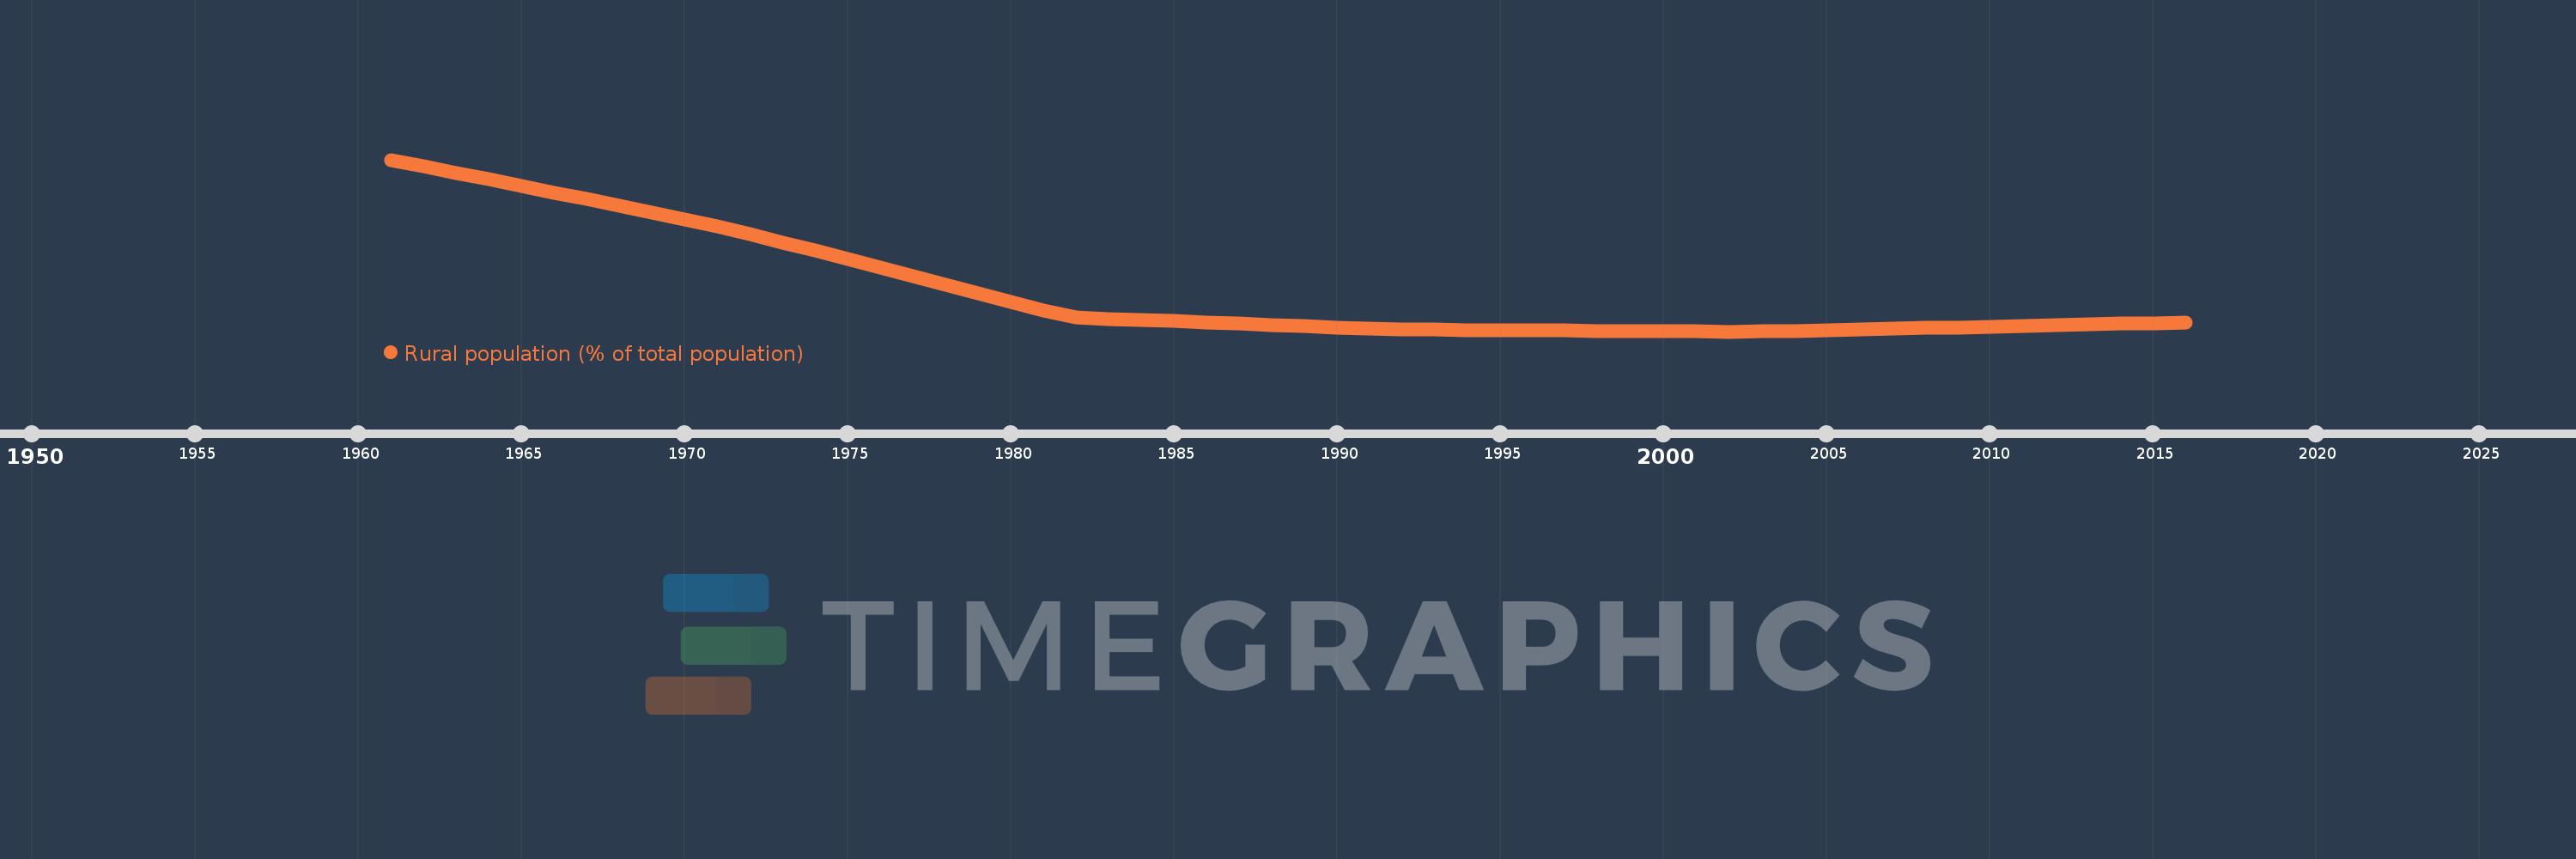
Rural population (% of total population)
2016,2015,2014,2013,2012,2011,2010,2009,2008,2007,2006,2005,2004,2003,2002,2001,2000,1999,1998,1997,1996,1995,1994,1993,1992,1991,1990,1989,1988,1987,1986,1985,1984,1983,1982,1981,1980,1979,1978,1977,1976,1975,1974,1973,1972,1971,1970,1969,1968,1967,1966,1965,1964,1963,1962,1961
This statistics in other country:
AfghanistanAlbaniaAlgeriaAmerican SamoaAndorraAngolaAntigua and BarbudaArab WorldArgentinaArmeniaArubaAustraliaAustriaAzerbaijanBahamas, TheBahrainBangladeshBarbadosBelarusBelgiumBelizeBeninBermudaBhutanBoliviaBosnia and HerzegovinaBotswanaBrazilBritish Virgin IslandsBrunei DarussalamBulgariaBurkina FasoBurundiCabo VerdeCambodiaCameroonCanadaCaribbean small statesCayman IslandsCentral African RepublicCentral Europe and the BalticsChadChannel IslandsChileChinaColombiaComorosCongo, Dem. Rep.Congo, Rep.Costa RicaCote d'IvoireCroatiaCubaCuracaoCyprusCzech RepublicDenmarkDjiboutiDominicaDominican RepublicEarly-demographic dividendEast Asia & PacificEast Asia & Pacific (excluding high income)East Asia & Pacific (IDA & IBRD countries)EcuadorEgypt, Arab Rep.El SalvadorEquatorial GuineaEritreaEstoniaEthiopiaEuro areaEurope & Central AsiaEurope & Central Asia (excluding high income)Europe & Central Asia (IDA & IBRD countries)European UnionFaroe IslandsFijiFinlandFragile and conflict affected situationsFranceFrench PolynesiaGabonGambia, TheGeorgiaGermanyGhanaGibraltarGreeceGreenlandGrenadaGuamGuatemalaGuineaGuinea-BissauGuyanaHaitiHeavily indebted poor countries (HIPC)High incomeHondurasHong Kong SAR, ChinaHungaryIBRD onlyIcelandIDA & IBRD totalIDA blendIDA onlyIDA totalIndiaIndonesiaIran, Islamic Rep.IraqIrelandIsle of ManIsraelItalyJamaicaJapanJordanKazakhstanKenyaKiribatiKorea, Dem. People’s Rep.Korea, Rep.KuwaitKyrgyz RepublicLao PDRLate-demographic dividendLatin America & Caribbean Latin America & Caribbean (excluding high income)Latin America & the Caribbean (IDA & IBRD countries)LatviaLeast developed countries: UN classificationLebanonLesothoLiberiaLibyaLiechtensteinLithuaniaLow & middle incomeLow incomeLower middle incomeLuxembourgMacao SAR, ChinaMacedonia, FYRMadagascarMalawiMalaysiaMaldivesMaliMaltaMarshall IslandsMauritaniaMauritiusMexicoMicronesia, Fed. Sts.Middle East & North AfricaMiddle East & North Africa (excluding high income)Middle East & North Africa (IDA & IBRD countries)Middle incomeMoldovaMonacoMongoliaMontenegroMoroccoMozambiqueMyanmarNamibiaNauruNepalNetherlandsNew CaledoniaNew ZealandNicaraguaNigerNigeriaNorth AmericaNorthern Mariana IslandsNorwayOECD membersOmanOther small statesPacific island small statesPakistanPalauPanamaPapua New GuineaParaguayPeruPhilippinesPolandPortugalPost-demographic dividendPre-demographic dividendPuerto RicoQatarRomaniaRussian FederationRwandaSamoaSan MarinoSao Tome and PrincipeSaudi ArabiaSenegalSerbiaSeychellesSierra LeoneSingaporeSint Maarten (Dutch part)Slovak RepublicSloveniaSmall statesSolomon IslandsSomaliaSouth AfricaSouth AsiaSouth Asia (IDA & IBRD)South SudanSpainSri LankaSt. Kitts and NevisSt. LuciaSt. Vincent and the GrenadinesSub-Saharan Africa Sub-Saharan Africa (excluding high income)Sub-Saharan Africa (IDA & IBRD countries)SudanSurinameSwazilandSwedenSwitzerlandSyrian Arab RepublicTajikistanTanzaniaThailandTimor-LesteTogoTongaTrinidad and TobagoTunisiaTurkeyTurkmenistanTurks and Caicos IslandsTuvaluUgandaUkraineUnited Arab EmiratesUnited KingdomUnited StatesUpper middle incomeUruguayUzbekistanVanuatuVenezuela, RBVietnamVirgin Islands (U.S.)West Bank and GazaWorldYemen, Rep.ZambiaZimbabwe Timeline:
This timeline shows a graph from 1961 to 2016 of Slovenia. No data until 1960. Number of actual observations by date: 56.
Source name:
World Development Indicators
Source organization:
World Bank Staff estimates based on United Nations, World Urbanization Prospects.
Categories, topics:
Agriculture & Rural Development
Last updated:
apr 23, 2017
Indicators value changes by year
Maximum:
71.796
jan 1, 1961
At the date of observation
Value
Absolute change
Change from previous value
jan 1, 1961
71.796
+71.796
0.0%
jan 1, 1962
70.893
-0.903
-1.26%
jan 1, 1963
70.066
-0.827
-1.17%
jan 1, 1964
69.224
-0.842
-1.2%
jan 1, 1965
68.369
-0.855
-1.24%
jan 1, 1966
67.503
-0.866
-1.27%
jan 1, 1967
66.624
-0.879
-1.3%
jan 1, 1968
65.734
-0.89
-1.34%
jan 1, 1969
64.831
-0.903
-1.37%
jan 1, 1970
63.919
-0.912
-1.41%
jan 1, 1971
62.996
-0.923
-1.44%
jan 1, 1972
62.028
-0.968
-1.54%
jan 1, 1973
60.942
-1.086
-1.75%
jan 1, 1974
59.847
-1.095
-1.8%
jan 1, 1975
58.741
-1.106
-1.85%
jan 1, 1976
57.626
-1.115
-1.9%
jan 1, 1977
56.501
-1.125
-1.95%
jan 1, 1978
55.373
-1.128
-2.0%
jan 1, 1979
54.238
-1.135
-2.05%
jan 1, 1980
53.099
-1.139
-2.1%
jan 1, 1981
51.955
-1.144
-2.15%
jan 1, 1982
51.06
-0.895
-1.72%
jan 1, 1983
50.9
-0.16
-0.31%
jan 1, 1984
50.74
-0.16
-0.31%
jan 1, 1985
50.58
-0.16
-0.32%
jan 1, 1986
50.42
-0.16
-0.32%
jan 1, 1987
50.26
-0.16
-0.32%
jan 1, 1988
50.1
-0.16
-0.32%
jan 1, 1989
49.939
-0.161
-0.32%
jan 1, 1990
49.78
-0.159
-0.32%
jan 1, 1991
49.62
-0.16
-0.32%
jan 1, 1992
49.493
-0.127
-0.26%
jan 1, 1993
49.466
-0.027
-0.05%
jan 1, 1994
49.439
-0.027
-0.05%
jan 1, 1995
49.411
-0.028
-0.06%
jan 1, 1996
49.384
-0.027
-0.05%
jan 1, 1997
49.357
-0.027
-0.05%
jan 1, 1998
49.329
-0.028
-0.06%
jan 1, 1999
49.302
-0.027
-0.05%
jan 1, 2000
49.275
-0.027
-0.05%
jan 1, 2001
49.248
-0.027
-0.05%
jan 1, 2002
49.22
-0.028
-0.06%
jan 1, 2003
49.223
+0.003
0.01%
jan 1, 2004
49.315
+0.092
0.19%
jan 1, 2005
49.407
+0.092
0.19%
jan 1, 2006
49.499
+0.092
0.19%
jan 1, 2007
49.591
+0.092
0.19%
jan 1, 2008
49.683
+0.092
0.19%
jan 1, 2009
49.776
+0.093
0.19%
jan 1, 2010
49.867
+0.091
0.18%
jan 1, 2011
49.96
+0.093
0.19%
jan 1, 2012
50.052
+0.092
0.18%
jan 1, 2013
50.144
+0.092
0.18%
jan 1, 2014
50.236
+0.092
0.18%
jan 1, 2015
50.305
+0.069
0.14%
jan 1, 2016
50.35
+0.045
0.09%
Ranking of countries by current statistics by years


Comments: