29
/
en
AIzaSyAYiBZKx7MnpbEhh9jyipgxe19OcubqV5w
April 1, 2024
33032
Europe & Central Asia (IDA & IBRD countries)
TEC
false
2
1
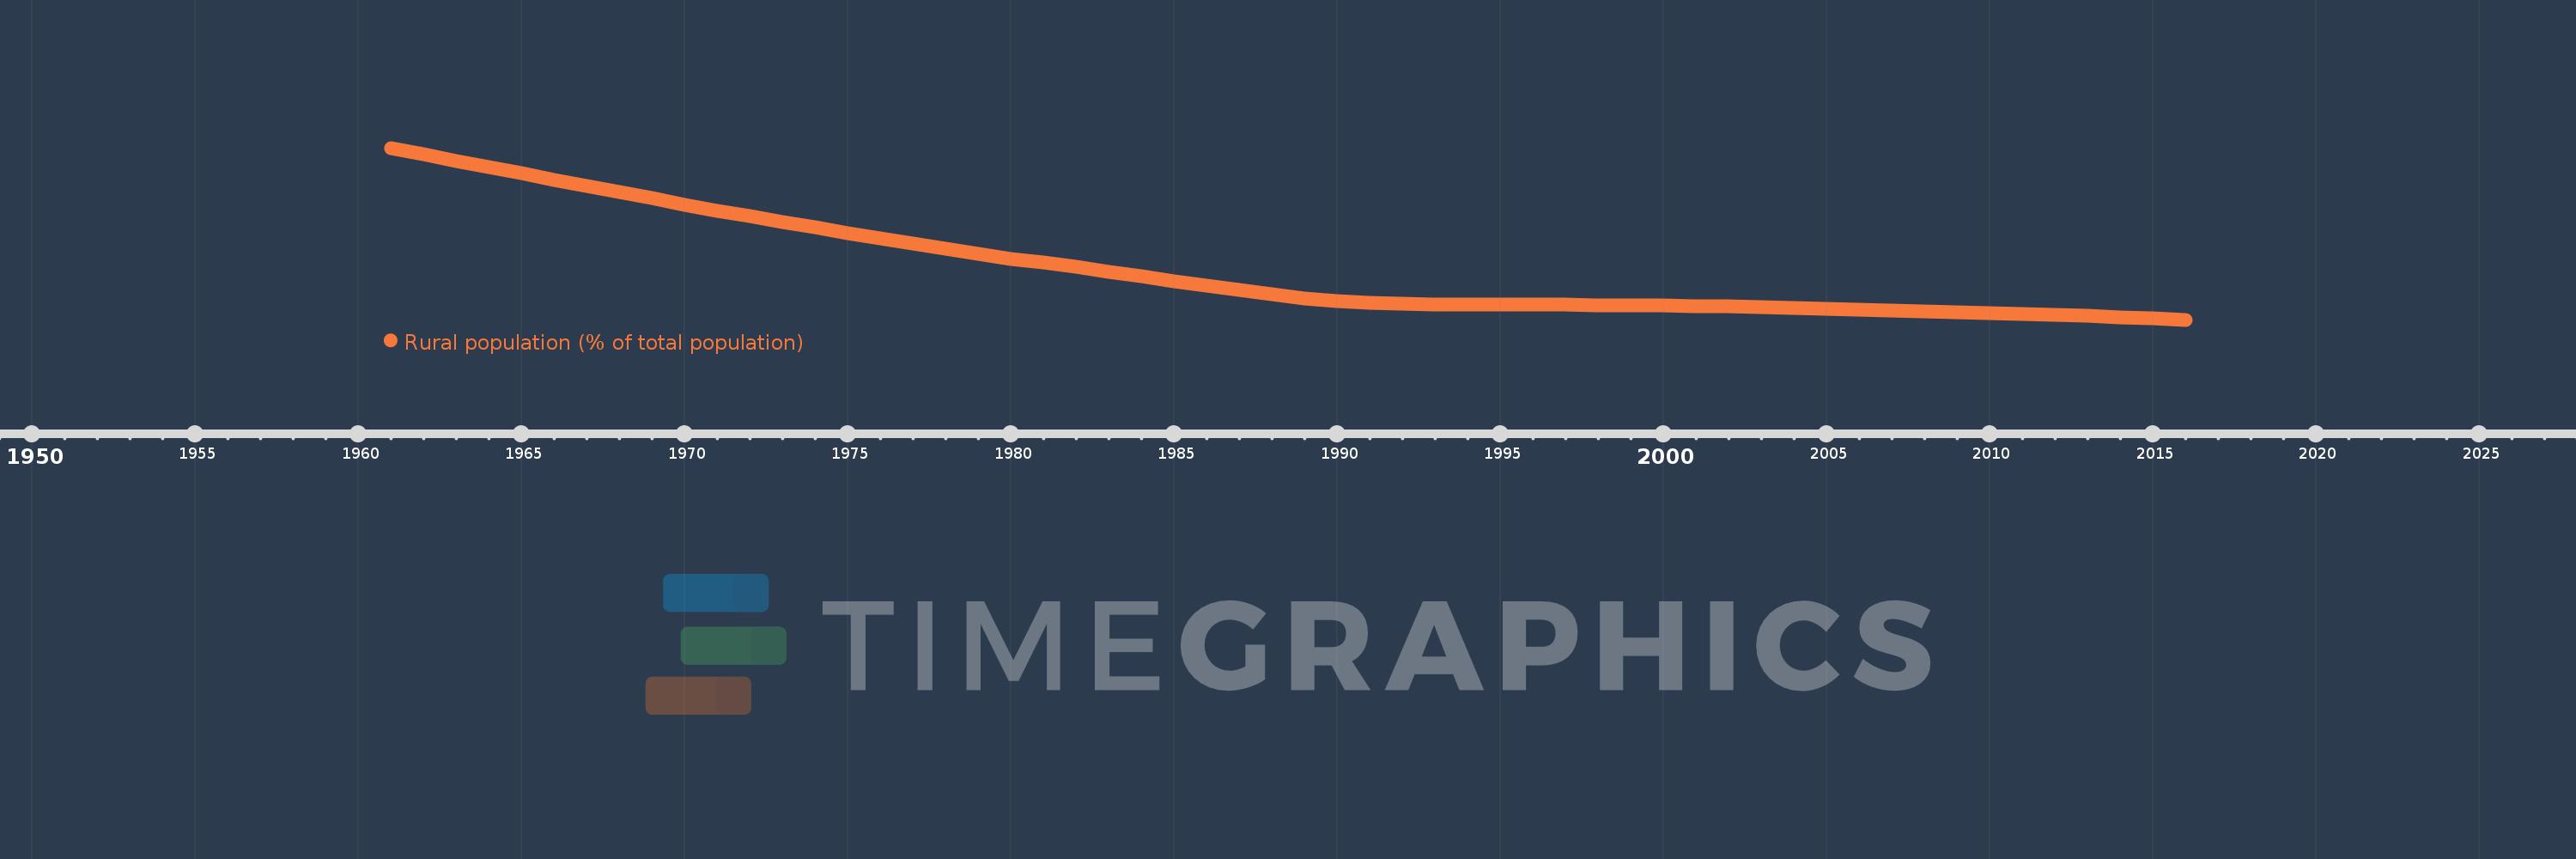
Rural population (% of total population)
2016,2015,2014,2013,2012,2011,2010,2009,2008,2007,2006,2005,2004,2003,2002,2001,2000,1999,1998,1997,1996,1995,1994,1993,1992,1991,1990,1989,1988,1987,1986,1985,1984,1983,1982,1981,1980,1979,1978,1977,1976,1975,1974,1973,1972,1971,1970,1969,1968,1967,1966,1965,1964,1963,1962,1961
This statistics in other country:
AfghanistanAlbaniaAlgeriaAmerican SamoaAndorraAngolaAntigua and BarbudaArab WorldArgentinaArmeniaArubaAustraliaAustriaAzerbaijanBahamas, TheBahrainBangladeshBarbadosBelarusBelgiumBelizeBeninBermudaBhutanBoliviaBosnia and HerzegovinaBotswanaBrazilBritish Virgin IslandsBrunei DarussalamBulgariaBurkina FasoBurundiCabo VerdeCambodiaCameroonCanadaCaribbean small statesCayman IslandsCentral African RepublicCentral Europe and the BalticsChadChannel IslandsChileChinaColombiaComorosCongo, Dem. Rep.Congo, Rep.Costa RicaCote d'IvoireCroatiaCubaCuracaoCyprusCzech RepublicDenmarkDjiboutiDominicaDominican RepublicEarly-demographic dividendEast Asia & PacificEast Asia & Pacific (excluding high income)East Asia & Pacific (IDA & IBRD countries)EcuadorEgypt, Arab Rep.El SalvadorEquatorial GuineaEritreaEstoniaEthiopiaEuro areaEurope & Central AsiaEurope & Central Asia (excluding high income)Europe & Central Asia (IDA & IBRD countries)European UnionFaroe IslandsFijiFinlandFragile and conflict affected situationsFranceFrench PolynesiaGabonGambia, TheGeorgiaGermanyGhanaGibraltarGreeceGreenlandGrenadaGuamGuatemalaGuineaGuinea-BissauGuyanaHaitiHeavily indebted poor countries (HIPC)High incomeHondurasHong Kong SAR, ChinaHungaryIBRD onlyIcelandIDA & IBRD totalIDA blendIDA onlyIDA totalIndiaIndonesiaIran, Islamic Rep.IraqIrelandIsle of ManIsraelItalyJamaicaJapanJordanKazakhstanKenyaKiribatiKorea, Dem. People’s Rep.Korea, Rep.KuwaitKyrgyz RepublicLao PDRLate-demographic dividendLatin America & Caribbean Latin America & Caribbean (excluding high income)Latin America & the Caribbean (IDA & IBRD countries)LatviaLeast developed countries: UN classificationLebanonLesothoLiberiaLibyaLiechtensteinLithuaniaLow & middle incomeLow incomeLower middle incomeLuxembourgMacao SAR, ChinaMacedonia, FYRMadagascarMalawiMalaysiaMaldivesMaliMaltaMarshall IslandsMauritaniaMauritiusMexicoMicronesia, Fed. Sts.Middle East & North AfricaMiddle East & North Africa (excluding high income)Middle East & North Africa (IDA & IBRD countries)Middle incomeMoldovaMonacoMongoliaMontenegroMoroccoMozambiqueMyanmarNamibiaNauruNepalNetherlandsNew CaledoniaNew ZealandNicaraguaNigerNigeriaNorth AmericaNorthern Mariana IslandsNorwayOECD membersOmanOther small statesPacific island small statesPakistanPalauPanamaPapua New GuineaParaguayPeruPhilippinesPolandPortugalPost-demographic dividendPre-demographic dividendPuerto RicoQatarRomaniaRussian FederationRwandaSamoaSan MarinoSao Tome and PrincipeSaudi ArabiaSenegalSerbiaSeychellesSierra LeoneSingaporeSint Maarten (Dutch part)Slovak RepublicSloveniaSmall statesSolomon IslandsSomaliaSouth AfricaSouth AsiaSouth Asia (IDA & IBRD)South SudanSpainSri LankaSt. Kitts and NevisSt. LuciaSt. Vincent and the GrenadinesSub-Saharan Africa Sub-Saharan Africa (excluding high income)Sub-Saharan Africa (IDA & IBRD countries)SudanSurinameSwazilandSwedenSwitzerlandSyrian Arab RepublicTajikistanTanzaniaThailandTimor-LesteTogoTongaTrinidad and TobagoTunisiaTurkeyTurkmenistanTurks and Caicos IslandsTuvaluUgandaUkraineUnited Arab EmiratesUnited KingdomUnited StatesUpper middle incomeUruguayUzbekistanVanuatuVenezuela, RBVietnamVirgin Islands (U.S.)West Bank and GazaWorldYemen, Rep.ZambiaZimbabwe Timeline:
This timeline shows a graph from 1961 to 2016 of Europe & Central Asia (IDA & IBRD countries). No data until 1960. Number of actual observations by date: 56.
Source name:
World Development Indicators
Source organization:
World Bank Staff estimates based on United Nations, World Urbanization Prospects.
Categories, topics:
Agriculture & Rural Development
Last updated:
apr 23, 2017
Indicators value changes by year
Minimum:
35.354
jan 1, 2016
Maximum:
54.998
jan 1, 1961
At the date of observation
Value
Absolute change
Change from previous value
jan 1, 1961
54.998
+54.998
0.0%
jan 1, 1962
54.256
-0.743
-1.35%
jan 1, 1963
53.535
-0.721
-1.33%
jan 1, 1964
52.814
-0.721
-1.35%
jan 1, 1965
52.092
-0.721
-1.37%
jan 1, 1966
51.359
-0.734
-1.41%
jan 1, 1967
50.644
-0.715
-1.39%
jan 1, 1968
49.94
-0.703
-1.39%
jan 1, 1969
49.236
-0.704
-1.41%
jan 1, 1970
48.535
-0.701
-1.42%
jan 1, 1971
47.846
-0.69
-1.42%
jan 1, 1972
47.182
-0.663
-1.39%
jan 1, 1973
46.534
-0.648
-1.37%
jan 1, 1974
45.889
-0.645
-1.39%
jan 1, 1975
45.249
-0.64
-1.39%
jan 1, 1976
44.632
-0.616
-1.36%
jan 1, 1977
44.033
-0.599
-1.34%
jan 1, 1978
43.441
-0.592
-1.34%
jan 1, 1979
42.847
-0.594
-1.37%
jan 1, 1980
42.335
-0.513
-1.2%
jan 1, 1981
41.912
-0.423
-1.0%
jan 1, 1982
41.398
-0.514
-1.23%
jan 1, 1983
40.853
-0.544
-1.32%
jan 1, 1984
40.308
-0.545
-1.33%
jan 1, 1985
39.754
-0.554
-1.37%
jan 1, 1986
39.215
-0.539
-1.36%
jan 1, 1987
38.72
-0.495
-1.26%
jan 1, 1988
38.246
-0.474
-1.22%
jan 1, 1989
37.773
-0.473
-1.24%
jan 1, 1990
37.453
-0.32
-0.85%
jan 1, 1991
37.291
-0.162
-0.43%
jan 1, 1992
37.184
-0.107
-0.29%
jan 1, 1993
37.14
-0.043
-0.12%
jan 1, 1994
37.129
-0.011
-0.03%
jan 1, 1995
37.11
-0.019
-0.05%
jan 1, 1996
37.079
-0.03
-0.08%
jan 1, 1997
37.058
-0.021
-0.06%
jan 1, 1998
37.037
-0.021
-0.06%
jan 1, 1999
37.005
-0.032
-0.09%
jan 1, 2000
36.972
-0.033
-0.09%
jan 1, 2001
36.935
-0.037
-0.1%
jan 1, 2002
36.88
-0.055
-0.15%
jan 1, 2003
36.802
-0.078
-0.21%
jan 1, 2004
36.709
-0.093
-0.25%
jan 1, 2005
36.61
-0.099
-0.27%
jan 1, 2006
36.509
-0.101
-0.28%
jan 1, 2007
36.409
-0.1
-0.27%
jan 1, 2008
36.303
-0.106
-0.29%
jan 1, 2009
36.198
-0.104
-0.29%
jan 1, 2010
36.101
-0.097
-0.27%
jan 1, 2011
36.011
-0.09
-0.25%
jan 1, 2012
35.912
-0.099
-0.27%
jan 1, 2013
35.782
-0.13
-0.36%
jan 1, 2014
35.644
-0.138
-0.39%
jan 1, 2015
35.5
-0.143
-0.4%
jan 1, 2016
35.354
-0.147
-0.41%
Ranking of countries by current statistics by years


Comments: