29
/
en
AIzaSyAYiBZKx7MnpbEhh9jyipgxe19OcubqV5w
April 1, 2024
103026
Central African Republic
CAF
true
2
1
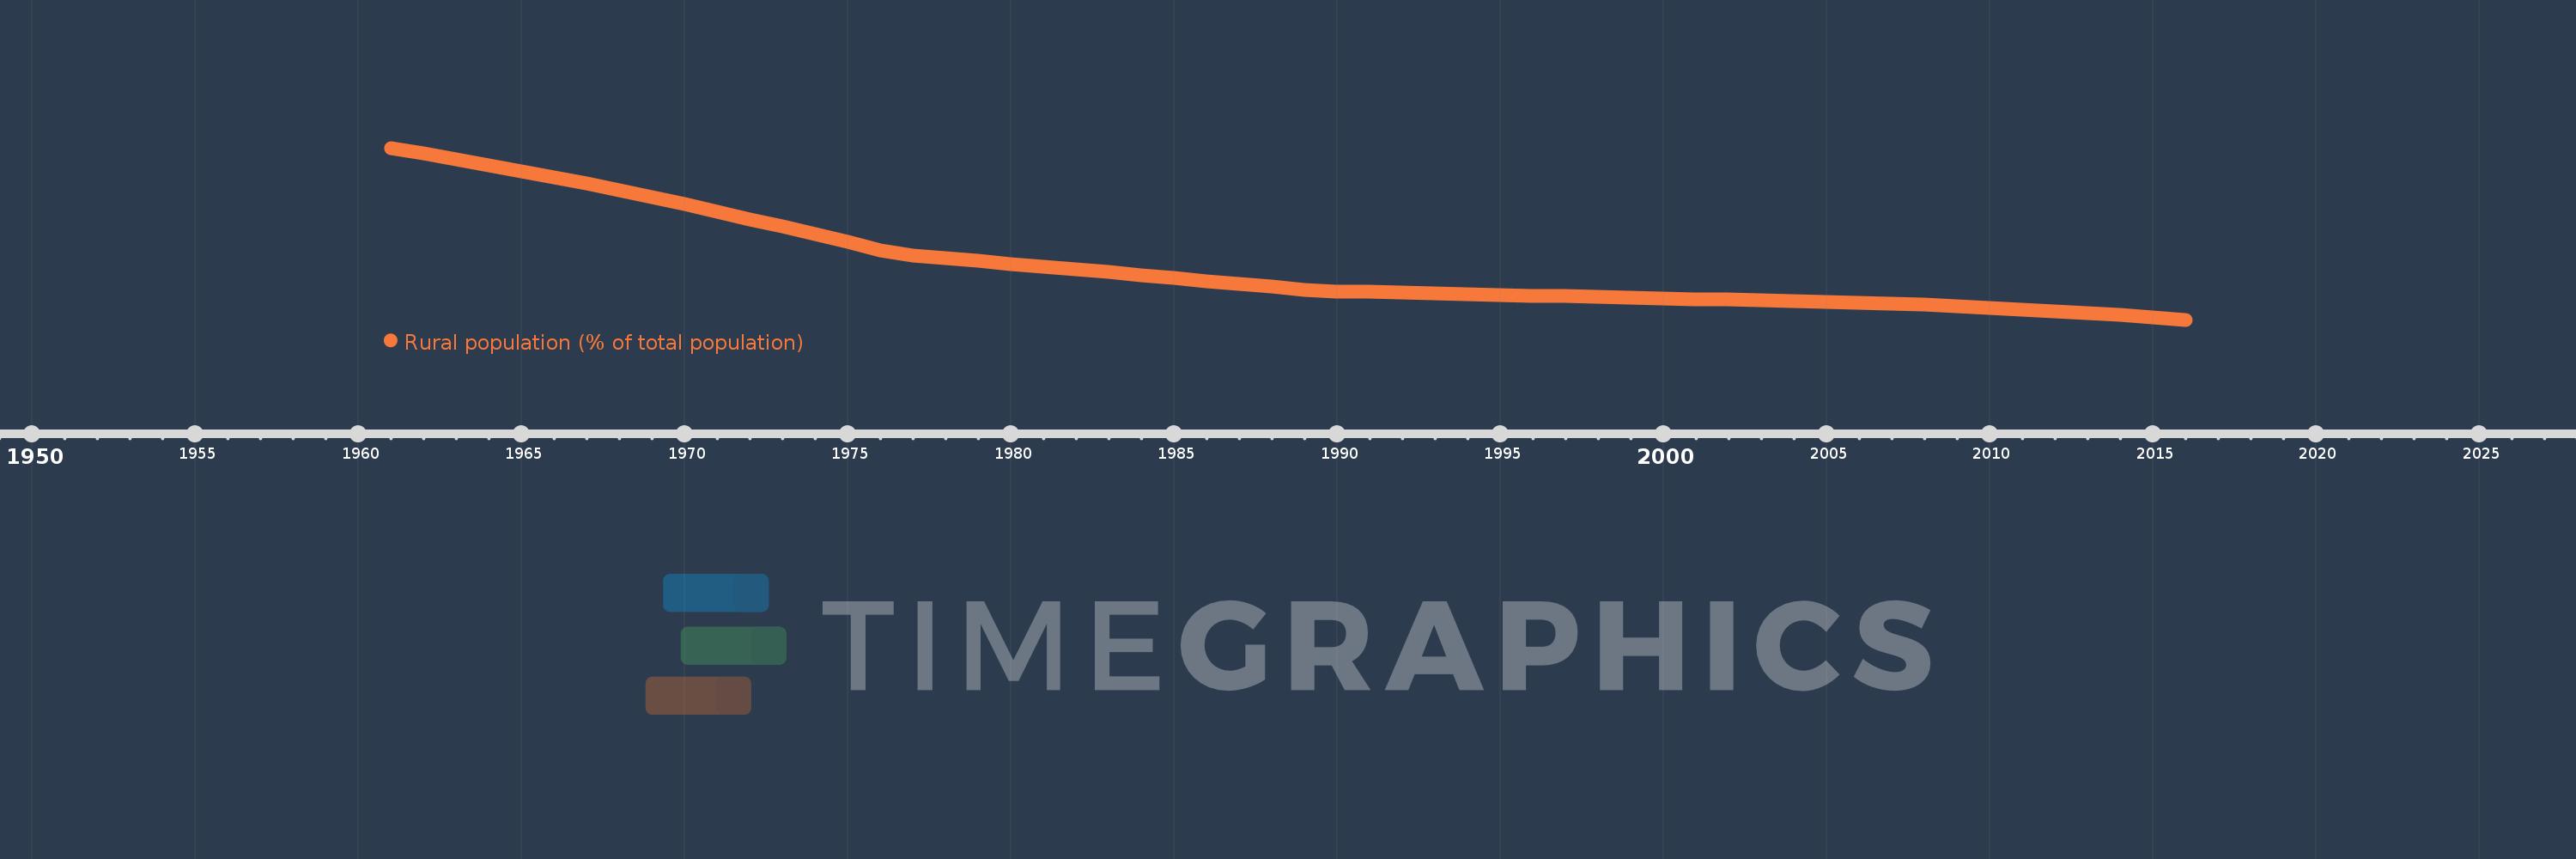
Rural population (% of total population)
2016,2015,2014,2013,2012,2011,2010,2009,2008,2007,2006,2005,2004,2003,2002,2001,2000,1999,1998,1997,1996,1995,1994,1993,1992,1991,1990,1989,1988,1987,1986,1985,1984,1983,1982,1981,1980,1979,1978,1977,1976,1975,1974,1973,1972,1971,1970,1969,1968,1967,1966,1965,1964,1963,1962,1961
This statistics in other country:
AfghanistanAlbaniaAlgeriaAmerican SamoaAndorraAngolaAntigua and BarbudaArab WorldArgentinaArmeniaArubaAustraliaAustriaAzerbaijanBahamas, TheBahrainBangladeshBarbadosBelarusBelgiumBelizeBeninBermudaBhutanBoliviaBosnia and HerzegovinaBotswanaBrazilBritish Virgin IslandsBrunei DarussalamBulgariaBurkina FasoBurundiCabo VerdeCambodiaCameroonCanadaCaribbean small statesCayman IslandsCentral African RepublicCentral Europe and the BalticsChadChannel IslandsChileChinaColombiaComorosCongo, Dem. Rep.Congo, Rep.Costa RicaCote d'IvoireCroatiaCubaCuracaoCyprusCzech RepublicDenmarkDjiboutiDominicaDominican RepublicEarly-demographic dividendEast Asia & PacificEast Asia & Pacific (excluding high income)East Asia & Pacific (IDA & IBRD countries)EcuadorEgypt, Arab Rep.El SalvadorEquatorial GuineaEritreaEstoniaEthiopiaEuro areaEurope & Central AsiaEurope & Central Asia (excluding high income)Europe & Central Asia (IDA & IBRD countries)European UnionFaroe IslandsFijiFinlandFragile and conflict affected situationsFranceFrench PolynesiaGabonGambia, TheGeorgiaGermanyGhanaGibraltarGreeceGreenlandGrenadaGuamGuatemalaGuineaGuinea-BissauGuyanaHaitiHeavily indebted poor countries (HIPC)High incomeHondurasHong Kong SAR, ChinaHungaryIBRD onlyIcelandIDA & IBRD totalIDA blendIDA onlyIDA totalIndiaIndonesiaIran, Islamic Rep.IraqIrelandIsle of ManIsraelItalyJamaicaJapanJordanKazakhstanKenyaKiribatiKorea, Dem. People’s Rep.Korea, Rep.KuwaitKyrgyz RepublicLao PDRLate-demographic dividendLatin America & Caribbean Latin America & Caribbean (excluding high income)Latin America & the Caribbean (IDA & IBRD countries)LatviaLeast developed countries: UN classificationLebanonLesothoLiberiaLibyaLiechtensteinLithuaniaLow & middle incomeLow incomeLower middle incomeLuxembourgMacao SAR, ChinaMacedonia, FYRMadagascarMalawiMalaysiaMaldivesMaliMaltaMarshall IslandsMauritaniaMauritiusMexicoMicronesia, Fed. Sts.Middle East & North AfricaMiddle East & North Africa (excluding high income)Middle East & North Africa (IDA & IBRD countries)Middle incomeMoldovaMonacoMongoliaMontenegroMoroccoMozambiqueMyanmarNamibiaNauruNepalNetherlandsNew CaledoniaNew ZealandNicaraguaNigerNigeriaNorth AmericaNorthern Mariana IslandsNorwayOECD membersOmanOther small statesPacific island small statesPakistanPalauPanamaPapua New GuineaParaguayPeruPhilippinesPolandPortugalPost-demographic dividendPre-demographic dividendPuerto RicoQatarRomaniaRussian FederationRwandaSamoaSan MarinoSao Tome and PrincipeSaudi ArabiaSenegalSerbiaSeychellesSierra LeoneSingaporeSint Maarten (Dutch part)Slovak RepublicSloveniaSmall statesSolomon IslandsSomaliaSouth AfricaSouth AsiaSouth Asia (IDA & IBRD)South SudanSpainSri LankaSt. Kitts and NevisSt. LuciaSt. Vincent and the GrenadinesSub-Saharan Africa Sub-Saharan Africa (excluding high income)Sub-Saharan Africa (IDA & IBRD countries)SudanSurinameSwazilandSwedenSwitzerlandSyrian Arab RepublicTajikistanTanzaniaThailandTimor-LesteTogoTongaTrinidad and TobagoTunisiaTurkeyTurkmenistanTurks and Caicos IslandsTuvaluUgandaUkraineUnited Arab EmiratesUnited KingdomUnited StatesUpper middle incomeUruguayUzbekistanVanuatuVenezuela, RBVietnamVirgin Islands (U.S.)West Bank and GazaWorldYemen, Rep.ZambiaZimbabwe Timeline:
This timeline shows a graph from 1961 to 2016 of Central African Republic. No data until 1960. Number of actual observations by date: 56.
Source name:
World Development Indicators
Source organization:
World Bank Staff estimates based on United Nations, World Urbanization Prospects.
Categories, topics:
Agriculture & Rural Development
Last updated:
apr 23, 2017
Indicators value changes by year
Minimum:
59.963
jan 1, 2016
At the date of observation
Value
Absolute change
Change from previous value
jan 1, 1961
79.9
+79.9
0.0%
jan 1, 1962
79.249
-0.651
-0.81%
jan 1, 1963
78.582
-0.667
-0.84%
jan 1, 1964
77.9
-0.682
-0.87%
jan 1, 1965
77.197
-0.703
-0.9%
jan 1, 1966
76.481
-0.716
-0.93%
jan 1, 1967
75.748
-0.733
-0.96%
jan 1, 1968
75.0
-0.748
-0.99%
jan 1, 1969
74.185
-0.815
-1.09%
jan 1, 1970
73.355
-0.83
-1.12%
jan 1, 1971
72.508
-0.847
-1.15%
jan 1, 1972
71.644
-0.864
-1.19%
jan 1, 1973
70.762
-0.882
-1.23%
jan 1, 1974
69.867
-0.895
-1.26%
jan 1, 1975
68.955
-0.912
-1.31%
jan 1, 1976
68.029
-0.926
-1.34%
jan 1, 1977
67.425
-0.604
-0.89%
jan 1, 1978
67.103
-0.322
-0.48%
jan 1, 1979
66.779
-0.324
-0.48%
jan 1, 1980
66.454
-0.325
-0.49%
jan 1, 1981
66.126
-0.328
-0.49%
jan 1, 1982
65.798
-0.328
-0.5%
jan 1, 1983
65.468
-0.33
-0.5%
jan 1, 1984
65.136
-0.332
-0.51%
jan 1, 1985
64.802
-0.334
-0.51%
jan 1, 1986
64.468
-0.334
-0.52%
jan 1, 1987
64.132
-0.336
-0.52%
jan 1, 1988
63.794
-0.338
-0.53%
jan 1, 1989
63.455
-0.339
-0.53%
jan 1, 1990
63.256
-0.199
-0.31%
jan 1, 1991
63.175
-0.081
-0.13%
jan 1, 1992
63.094
-0.081
-0.13%
jan 1, 1993
63.013
-0.081
-0.13%
jan 1, 1994
62.932
-0.081
-0.13%
jan 1, 1995
62.851
-0.081
-0.13%
jan 1, 1996
62.769
-0.082
-0.13%
jan 1, 1997
62.688
-0.081
-0.13%
jan 1, 1998
62.606
-0.082
-0.13%
jan 1, 1999
62.525
-0.081
-0.13%
jan 1, 2000
62.443
-0.082
-0.13%
jan 1, 2001
62.361
-0.082
-0.13%
jan 1, 2002
62.28
-0.081
-0.13%
jan 1, 2003
62.198
-0.082
-0.13%
jan 1, 2004
62.116
-0.082
-0.13%
jan 1, 2005
62.034
-0.082
-0.13%
jan 1, 2006
61.934
-0.1
-0.16%
jan 1, 2007
61.817
-0.117
-0.19%
jan 1, 2008
61.682
-0.135
-0.22%
jan 1, 2009
61.53
-0.152
-0.25%
jan 1, 2010
61.36
-0.17
-0.28%
jan 1, 2011
61.172
-0.188
-0.31%
jan 1, 2012
60.966
-0.206
-0.34%
jan 1, 2013
60.742
-0.224
-0.37%
jan 1, 2014
60.5
-0.242
-0.4%
jan 1, 2015
60.241
-0.259
-0.43%
jan 1, 2016
59.963
-0.278
-0.46%
Ranking of countries by current statistics by years


Comments: