29
/
en
AIzaSyAYiBZKx7MnpbEhh9jyipgxe19OcubqV5w
April 1, 2024
252453
St. Vincent and the Grenadines
VCT
true
2
1
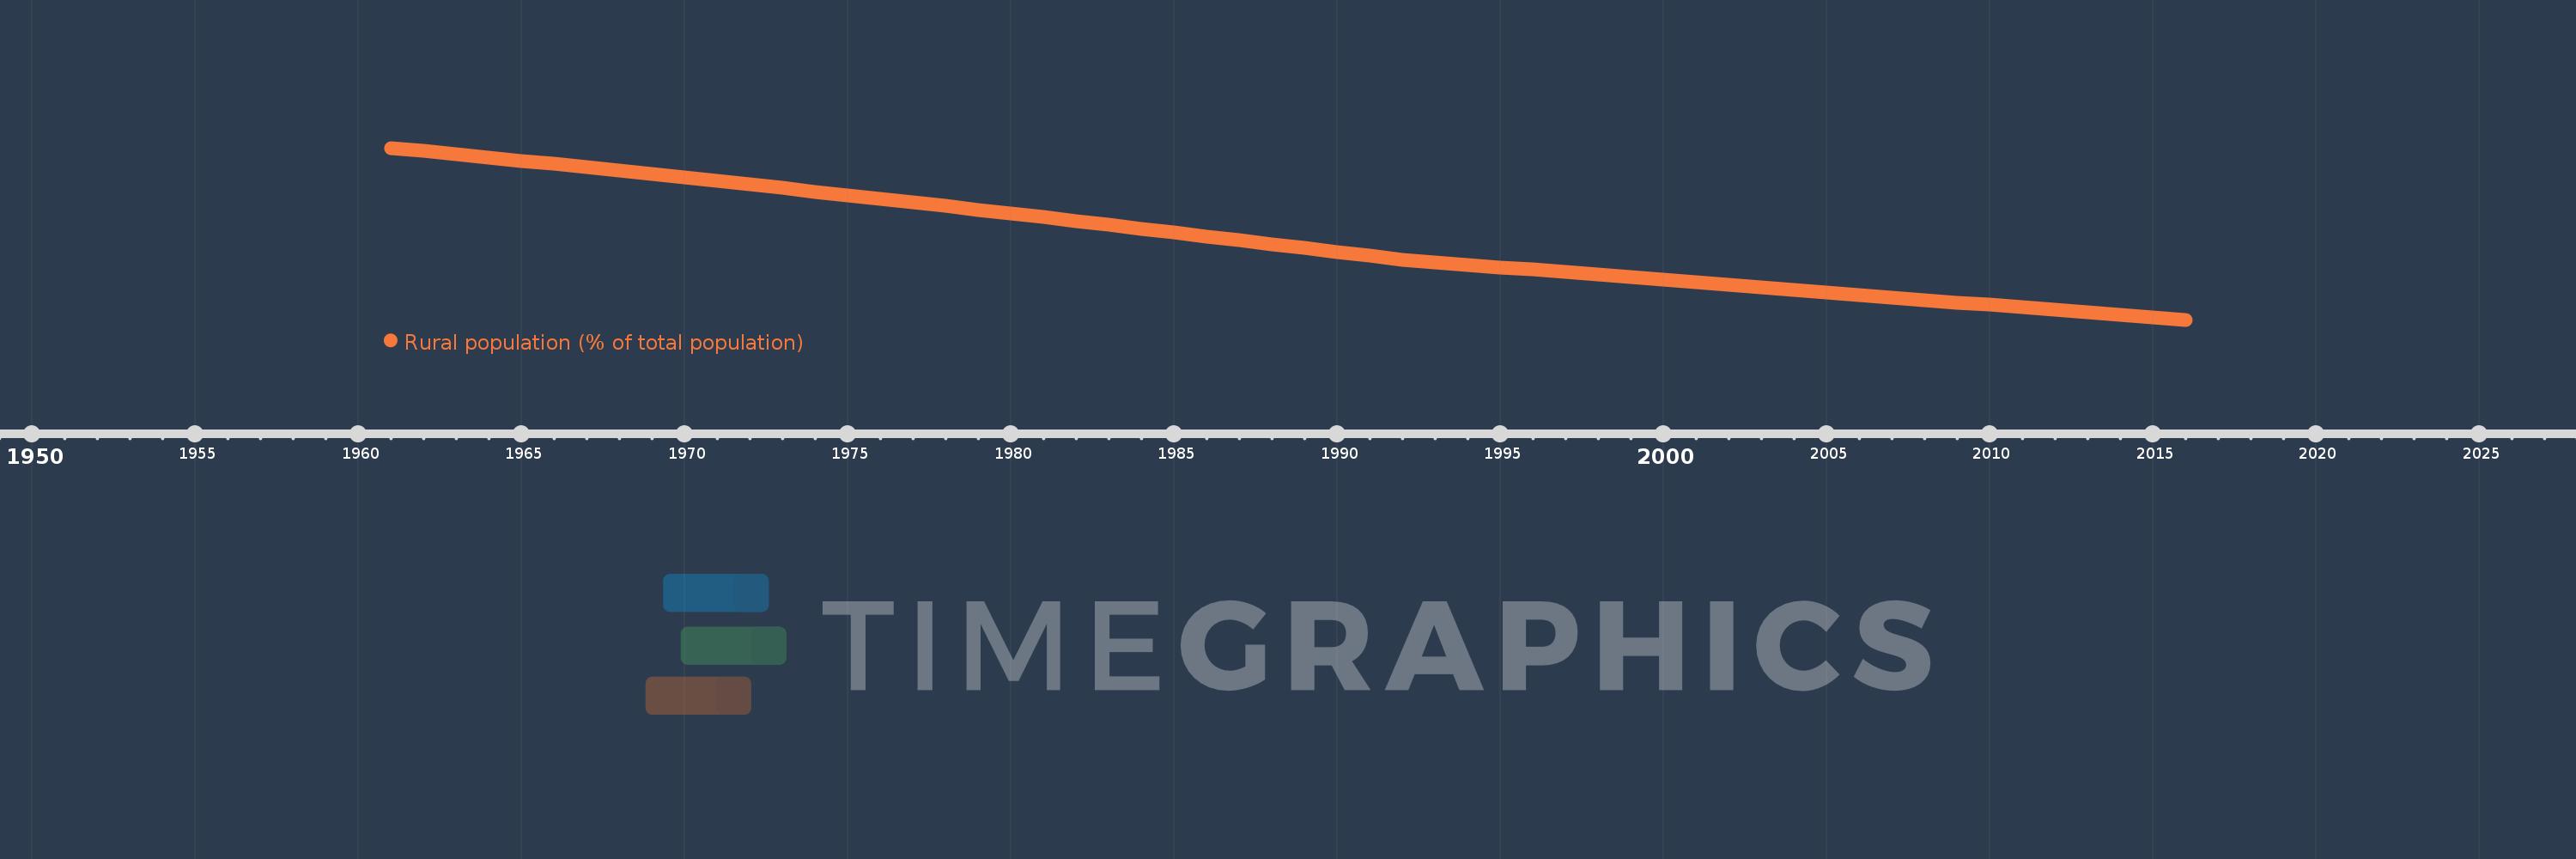
Rural population (% of total population)
2016,2015,2014,2013,2012,2011,2010,2009,2008,2007,2006,2005,2004,2003,2002,2001,2000,1999,1998,1997,1996,1995,1994,1993,1992,1991,1990,1989,1988,1987,1986,1985,1984,1983,1982,1981,1980,1979,1978,1977,1976,1975,1974,1973,1972,1971,1970,1969,1968,1967,1966,1965,1964,1963,1962,1961
This statistics in other country:
AfghanistanAlbaniaAlgeriaAmerican SamoaAndorraAngolaAntigua and BarbudaArab WorldArgentinaArmeniaArubaAustraliaAustriaAzerbaijanBahamas, TheBahrainBangladeshBarbadosBelarusBelgiumBelizeBeninBermudaBhutanBoliviaBosnia and HerzegovinaBotswanaBrazilBritish Virgin IslandsBrunei DarussalamBulgariaBurkina FasoBurundiCabo VerdeCambodiaCameroonCanadaCaribbean small statesCayman IslandsCentral African RepublicCentral Europe and the BalticsChadChannel IslandsChileChinaColombiaComorosCongo, Dem. Rep.Congo, Rep.Costa RicaCote d'IvoireCroatiaCubaCuracaoCyprusCzech RepublicDenmarkDjiboutiDominicaDominican RepublicEarly-demographic dividendEast Asia & PacificEast Asia & Pacific (excluding high income)East Asia & Pacific (IDA & IBRD countries)EcuadorEgypt, Arab Rep.El SalvadorEquatorial GuineaEritreaEstoniaEthiopiaEuro areaEurope & Central AsiaEurope & Central Asia (excluding high income)Europe & Central Asia (IDA & IBRD countries)European UnionFaroe IslandsFijiFinlandFragile and conflict affected situationsFranceFrench PolynesiaGabonGambia, TheGeorgiaGermanyGhanaGibraltarGreeceGreenlandGrenadaGuamGuatemalaGuineaGuinea-BissauGuyanaHaitiHeavily indebted poor countries (HIPC)High incomeHondurasHong Kong SAR, ChinaHungaryIBRD onlyIcelandIDA & IBRD totalIDA blendIDA onlyIDA totalIndiaIndonesiaIran, Islamic Rep.IraqIrelandIsle of ManIsraelItalyJamaicaJapanJordanKazakhstanKenyaKiribatiKorea, Dem. People’s Rep.Korea, Rep.KuwaitKyrgyz RepublicLao PDRLate-demographic dividendLatin America & Caribbean Latin America & Caribbean (excluding high income)Latin America & the Caribbean (IDA & IBRD countries)LatviaLeast developed countries: UN classificationLebanonLesothoLiberiaLibyaLiechtensteinLithuaniaLow & middle incomeLow incomeLower middle incomeLuxembourgMacao SAR, ChinaMacedonia, FYRMadagascarMalawiMalaysiaMaldivesMaliMaltaMarshall IslandsMauritaniaMauritiusMexicoMicronesia, Fed. Sts.Middle East & North AfricaMiddle East & North Africa (excluding high income)Middle East & North Africa (IDA & IBRD countries)Middle incomeMoldovaMonacoMongoliaMontenegroMoroccoMozambiqueMyanmarNamibiaNauruNepalNetherlandsNew CaledoniaNew ZealandNicaraguaNigerNigeriaNorth AmericaNorthern Mariana IslandsNorwayOECD membersOmanOther small statesPacific island small statesPakistanPalauPanamaPapua New GuineaParaguayPeruPhilippinesPolandPortugalPost-demographic dividendPre-demographic dividendPuerto RicoQatarRomaniaRussian FederationRwandaSamoaSan MarinoSao Tome and PrincipeSaudi ArabiaSenegalSerbiaSeychellesSierra LeoneSingaporeSint Maarten (Dutch part)Slovak RepublicSloveniaSmall statesSolomon IslandsSomaliaSouth AfricaSouth AsiaSouth Asia (IDA & IBRD)South SudanSpainSri LankaSt. Kitts and NevisSt. LuciaSt. Vincent and the GrenadinesSub-Saharan Africa Sub-Saharan Africa (excluding high income)Sub-Saharan Africa (IDA & IBRD countries)SudanSurinameSwazilandSwedenSwitzerlandSyrian Arab RepublicTajikistanTanzaniaThailandTimor-LesteTogoTongaTrinidad and TobagoTunisiaTurkeyTurkmenistanTurks and Caicos IslandsTuvaluUgandaUkraineUnited Arab EmiratesUnited KingdomUnited StatesUpper middle incomeUruguayUzbekistanVanuatuVenezuela, RBVietnamVirgin Islands (U.S.)West Bank and GazaWorldYemen, Rep.ZambiaZimbabwe Timeline:
This timeline shows a graph from 1961 to 2016 of St. Vincent and the Grenadines. No data until 1960. Number of actual observations by date: 56.
Source name:
World Development Indicators
Source organization:
World Bank Staff estimates based on United Nations, World Urbanization Prospects.
Categories, topics:
Agriculture & Rural Development
Last updated:
apr 23, 2017
Indicators value changes by year
Maximum:
74.057
jan 1, 1961
At the date of observation
Value
Absolute change
Change from previous value
jan 1, 1961
74.057
+74.057
0.0%
jan 1, 1962
73.606
-0.451
-0.61%
jan 1, 1963
73.149
-0.457
-0.62%
jan 1, 1964
72.686
-0.463
-0.63%
jan 1, 1965
72.219
-0.467
-0.64%
jan 1, 1966
71.748
-0.471
-0.65%
jan 1, 1967
71.271
-0.477
-0.66%
jan 1, 1968
70.79
-0.481
-0.67%
jan 1, 1969
70.303
-0.487
-0.69%
jan 1, 1970
69.813
-0.49
-0.7%
jan 1, 1971
69.317
-0.496
-0.71%
jan 1, 1972
68.818
-0.499
-0.72%
jan 1, 1973
68.313
-0.505
-0.73%
jan 1, 1974
67.805
-0.508
-0.74%
jan 1, 1975
67.292
-0.513
-0.76%
jan 1, 1976
66.775
-0.517
-0.77%
jan 1, 1977
66.253
-0.522
-0.78%
jan 1, 1978
65.729
-0.524
-0.79%
jan 1, 1979
65.2
-0.529
-0.8%
jan 1, 1980
64.667
-0.533
-0.82%
jan 1, 1981
64.13
-0.537
-0.83%
jan 1, 1982
63.591
-0.539
-0.84%
jan 1, 1983
63.047
-0.544
-0.86%
jan 1, 1984
62.5
-0.547
-0.87%
jan 1, 1985
61.95
-0.55
-0.88%
jan 1, 1986
61.398
-0.552
-0.89%
jan 1, 1987
60.842
-0.556
-0.91%
jan 1, 1988
60.283
-0.559
-0.92%
jan 1, 1989
59.72
-0.563
-0.93%
jan 1, 1990
59.157
-0.563
-0.94%
jan 1, 1991
58.591
-0.566
-0.96%
jan 1, 1992
58.051
-0.54
-0.92%
jan 1, 1993
57.694
-0.357
-0.61%
jan 1, 1994
57.337
-0.357
-0.62%
jan 1, 1995
56.979
-0.358
-0.62%
jan 1, 1996
56.62
-0.359
-0.63%
jan 1, 1997
56.259
-0.361
-0.64%
jan 1, 1998
55.9
-0.359
-0.64%
jan 1, 1999
55.539
-0.361
-0.65%
jan 1, 2000
55.177
-0.362
-0.65%
jan 1, 2001
54.814
-0.363
-0.66%
jan 1, 2002
54.452
-0.362
-0.66%
jan 1, 2003
54.09
-0.362
-0.66%
jan 1, 2004
53.728
-0.362
-0.67%
jan 1, 2005
53.367
-0.361
-0.67%
jan 1, 2006
53.007
-0.36
-0.67%
jan 1, 2007
52.647
-0.36
-0.68%
jan 1, 2008
52.287
-0.36
-0.68%
jan 1, 2009
51.929
-0.358
-0.68%
jan 1, 2010
51.572
-0.357
-0.69%
jan 1, 2011
51.215
-0.357
-0.69%
jan 1, 2012
50.86
-0.355
-0.69%
jan 1, 2013
50.505
-0.355
-0.7%
jan 1, 2014
50.152
-0.353
-0.7%
jan 1, 2015
49.8
-0.352
-0.7%
jan 1, 2016
49.45
-0.35
-0.7%
Ranking of countries by current statistics by years


Comments: