29
/
en
AIzaSyAYiBZKx7MnpbEhh9jyipgxe19OcubqV5w
April 1, 2024
198242
Moldova
MDA
true
2
1
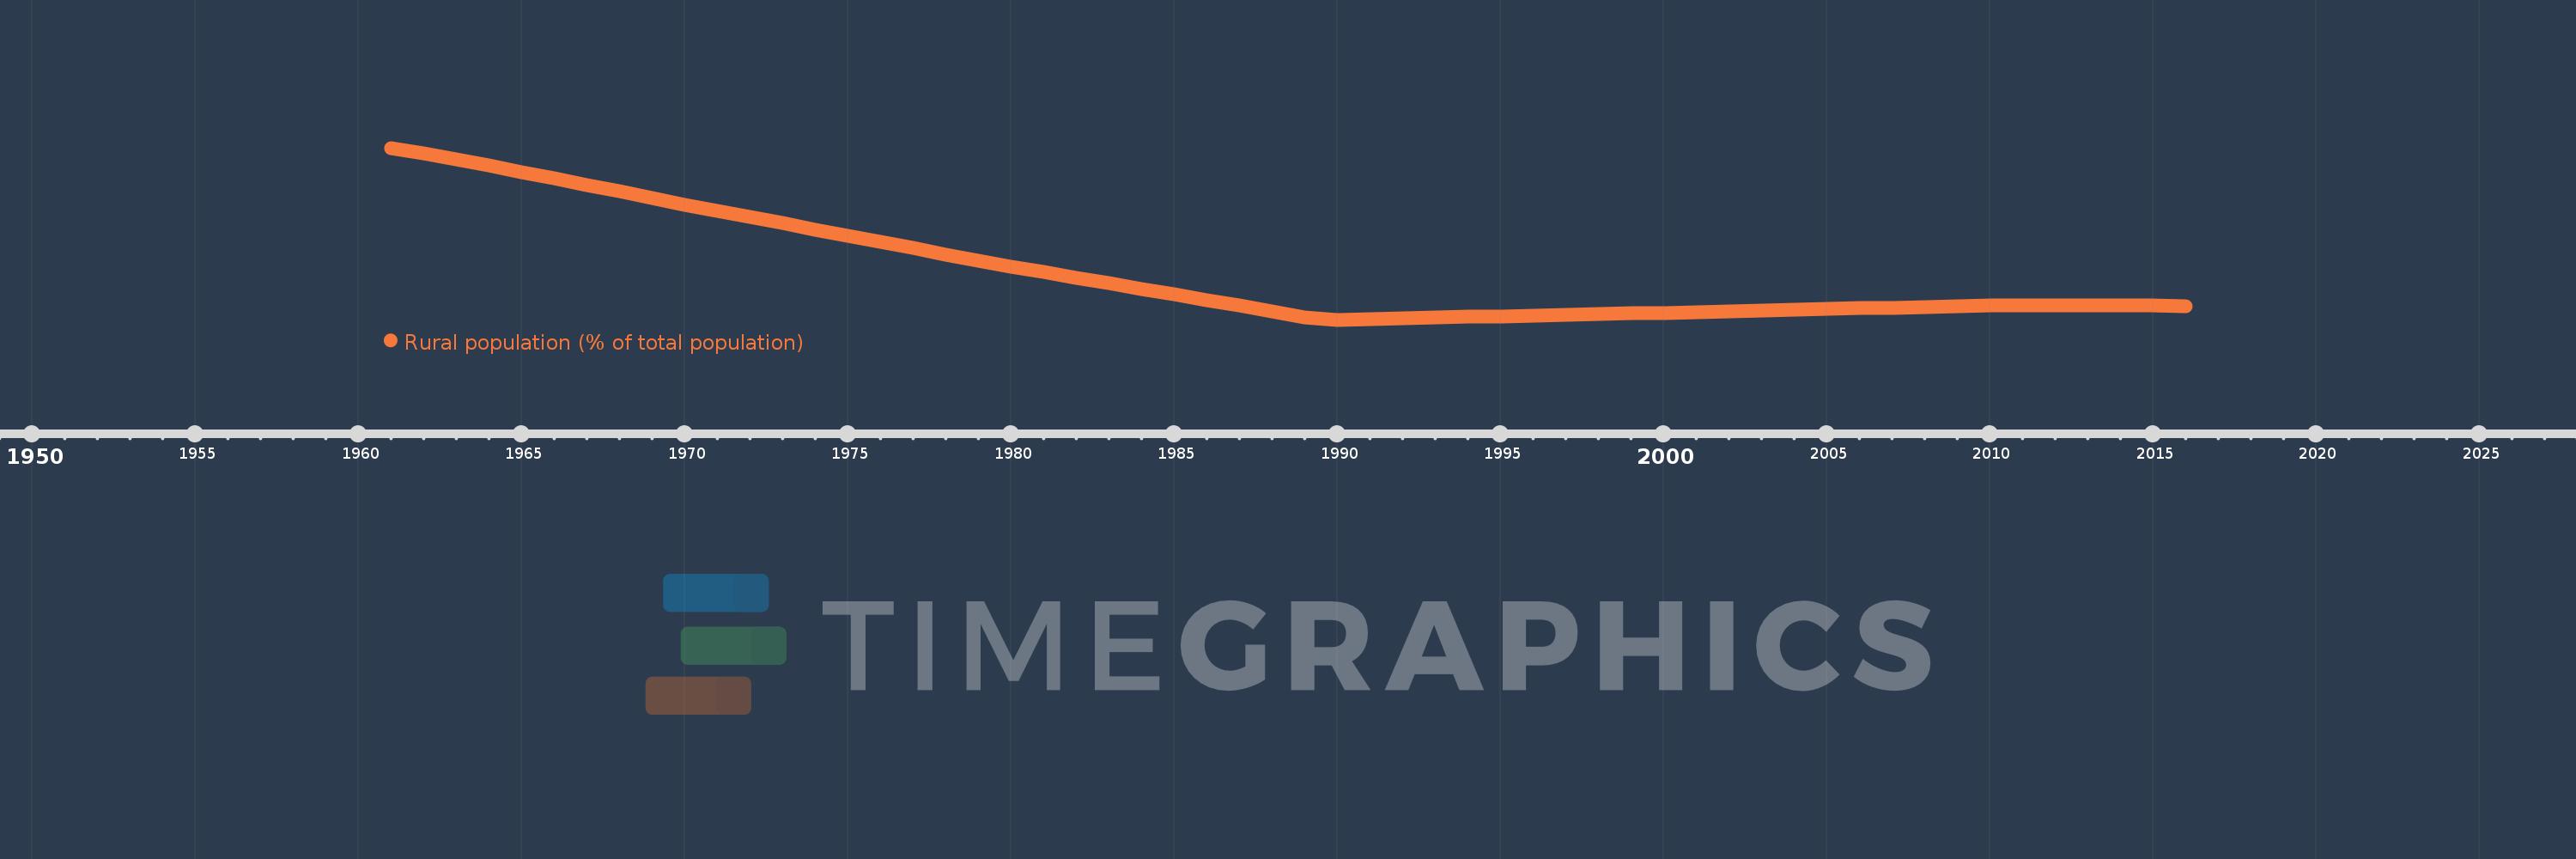
Rural population (% of total population)
2016,2015,2014,2013,2012,2011,2010,2009,2008,2007,2006,2005,2004,2003,2002,2001,2000,1999,1998,1997,1996,1995,1994,1993,1992,1991,1990,1989,1988,1987,1986,1985,1984,1983,1982,1981,1980,1979,1978,1977,1976,1975,1974,1973,1972,1971,1970,1969,1968,1967,1966,1965,1964,1963,1962,1961
This statistics in other country:
AfghanistanAlbaniaAlgeriaAmerican SamoaAndorraAngolaAntigua and BarbudaArab WorldArgentinaArmeniaArubaAustraliaAustriaAzerbaijanBahamas, TheBahrainBangladeshBarbadosBelarusBelgiumBelizeBeninBermudaBhutanBoliviaBosnia and HerzegovinaBotswanaBrazilBritish Virgin IslandsBrunei DarussalamBulgariaBurkina FasoBurundiCabo VerdeCambodiaCameroonCanadaCaribbean small statesCayman IslandsCentral African RepublicCentral Europe and the BalticsChadChannel IslandsChileChinaColombiaComorosCongo, Dem. Rep.Congo, Rep.Costa RicaCote d'IvoireCroatiaCubaCuracaoCyprusCzech RepublicDenmarkDjiboutiDominicaDominican RepublicEarly-demographic dividendEast Asia & PacificEast Asia & Pacific (excluding high income)East Asia & Pacific (IDA & IBRD countries)EcuadorEgypt, Arab Rep.El SalvadorEquatorial GuineaEritreaEstoniaEthiopiaEuro areaEurope & Central AsiaEurope & Central Asia (excluding high income)Europe & Central Asia (IDA & IBRD countries)European UnionFaroe IslandsFijiFinlandFragile and conflict affected situationsFranceFrench PolynesiaGabonGambia, TheGeorgiaGermanyGhanaGibraltarGreeceGreenlandGrenadaGuamGuatemalaGuineaGuinea-BissauGuyanaHaitiHeavily indebted poor countries (HIPC)High incomeHondurasHong Kong SAR, ChinaHungaryIBRD onlyIcelandIDA & IBRD totalIDA blendIDA onlyIDA totalIndiaIndonesiaIran, Islamic Rep.IraqIrelandIsle of ManIsraelItalyJamaicaJapanJordanKazakhstanKenyaKiribatiKorea, Dem. People’s Rep.Korea, Rep.KuwaitKyrgyz RepublicLao PDRLate-demographic dividendLatin America & Caribbean Latin America & Caribbean (excluding high income)Latin America & the Caribbean (IDA & IBRD countries)LatviaLeast developed countries: UN classificationLebanonLesothoLiberiaLibyaLiechtensteinLithuaniaLow & middle incomeLow incomeLower middle incomeLuxembourgMacao SAR, ChinaMacedonia, FYRMadagascarMalawiMalaysiaMaldivesMaliMaltaMarshall IslandsMauritaniaMauritiusMexicoMicronesia, Fed. Sts.Middle East & North AfricaMiddle East & North Africa (excluding high income)Middle East & North Africa (IDA & IBRD countries)Middle incomeMoldovaMonacoMongoliaMontenegroMoroccoMozambiqueMyanmarNamibiaNauruNepalNetherlandsNew CaledoniaNew ZealandNicaraguaNigerNigeriaNorth AmericaNorthern Mariana IslandsNorwayOECD membersOmanOther small statesPacific island small statesPakistanPalauPanamaPapua New GuineaParaguayPeruPhilippinesPolandPortugalPost-demographic dividendPre-demographic dividendPuerto RicoQatarRomaniaRussian FederationRwandaSamoaSan MarinoSao Tome and PrincipeSaudi ArabiaSenegalSerbiaSeychellesSierra LeoneSingaporeSint Maarten (Dutch part)Slovak RepublicSloveniaSmall statesSolomon IslandsSomaliaSouth AfricaSouth AsiaSouth Asia (IDA & IBRD)South SudanSpainSri LankaSt. Kitts and NevisSt. LuciaSt. Vincent and the GrenadinesSub-Saharan Africa Sub-Saharan Africa (excluding high income)Sub-Saharan Africa (IDA & IBRD countries)SudanSurinameSwazilandSwedenSwitzerlandSyrian Arab RepublicTajikistanTanzaniaThailandTimor-LesteTogoTongaTrinidad and TobagoTunisiaTurkeyTurkmenistanTurks and Caicos IslandsTuvaluUgandaUkraineUnited Arab EmiratesUnited KingdomUnited StatesUpper middle incomeUruguayUzbekistanVanuatuVenezuela, RBVietnamVirgin Islands (U.S.)West Bank and GazaWorldYemen, Rep.ZambiaZimbabwe Timeline:
This timeline shows a graph from 1961 to 2016 of Moldova. No data until 1960. Number of actual observations by date: 56.
Source name:
World Development Indicators
Source organization:
World Bank Staff estimates based on United Nations, World Urbanization Prospects.
Categories, topics:
Agriculture & Rural Development
Last updated:
apr 23, 2017
Indicators value changes by year
Minimum:
53.144
jan 1, 1990
Maximum:
76.576
jan 1, 1961
At the date of observation
Value
Absolute change
Change from previous value
jan 1, 1961
76.576
+76.576
0.0%
jan 1, 1962
75.784
-0.792
-1.03%
jan 1, 1963
74.973
-0.811
-1.07%
jan 1, 1964
74.144
-0.829
-1.11%
jan 1, 1965
73.297
-0.847
-1.14%
jan 1, 1966
72.434
-0.863
-1.18%
jan 1, 1967
71.553
-0.881
-1.22%
jan 1, 1968
70.655
-0.898
-1.26%
jan 1, 1969
69.74
-0.915
-1.3%
jan 1, 1970
68.811
-0.929
-1.33%
jan 1, 1971
67.932
-0.879
-1.28%
jan 1, 1972
67.121
-0.811
-1.19%
jan 1, 1973
66.299
-0.822
-1.22%
jan 1, 1974
65.469
-0.83
-1.25%
jan 1, 1975
64.628
-0.841
-1.28%
jan 1, 1976
63.778
-0.85
-1.32%
jan 1, 1977
62.918
-0.86
-1.35%
jan 1, 1978
62.052
-0.866
-1.38%
jan 1, 1979
61.178
-0.874
-1.41%
jan 1, 1980
60.36
-0.818
-1.34%
jan 1, 1981
59.613
-0.747
-1.24%
jan 1, 1982
58.864
-0.749
-1.26%
jan 1, 1983
58.109
-0.755
-1.28%
jan 1, 1984
57.351
-0.758
-1.3%
jan 1, 1985
56.588
-0.763
-1.33%
jan 1, 1986
55.824
-0.764
-1.35%
jan 1, 1987
55.056
-0.768
-1.38%
jan 1, 1988
54.286
-0.77
-1.4%
jan 1, 1989
53.512
-0.774
-1.43%
jan 1, 1990
53.144
-0.368
-0.69%
jan 1, 1991
53.238
+0.094
0.18%
jan 1, 1992
53.331
+0.093
0.17%
jan 1, 1993
53.425
+0.094
0.18%
jan 1, 1994
53.519
+0.094
0.18%
jan 1, 1995
53.613
+0.094
0.18%
jan 1, 1996
53.706
+0.093
0.17%
jan 1, 1997
53.8
+0.094
0.18%
jan 1, 1998
53.899
+0.099
0.18%
jan 1, 1999
53.998
+0.099
0.18%
jan 1, 2000
54.098
+0.1
0.19%
jan 1, 2001
54.197
+0.099
0.18%
jan 1, 2002
54.296
+0.099
0.18%
jan 1, 2003
54.395
+0.099
0.18%
jan 1, 2004
54.494
+0.099
0.18%
jan 1, 2005
54.593
+0.099
0.18%
jan 1, 2006
54.692
+0.099
0.18%
jan 1, 2007
54.791
+0.099
0.18%
jan 1, 2008
54.89
+0.099
0.18%
jan 1, 2009
54.989
+0.099
0.18%
jan 1, 2010
55.064
+0.075
0.14%
jan 1, 2011
55.114
+0.05
0.09%
jan 1, 2012
55.141
+0.027
0.05%
jan 1, 2013
55.143
+0.002
0.0%
jan 1, 2014
55.121
-0.022
-0.04%
jan 1, 2015
55.075
-0.046
-0.08%
jan 1, 2016
55.005
-0.07
-0.13%
Ranking of countries by current statistics by years


Comments: