29
/
en
AIzaSyAYiBZKx7MnpbEhh9jyipgxe19OcubqV5w
April 1, 2024
64071
Afghanistan
AFG
true
2
1
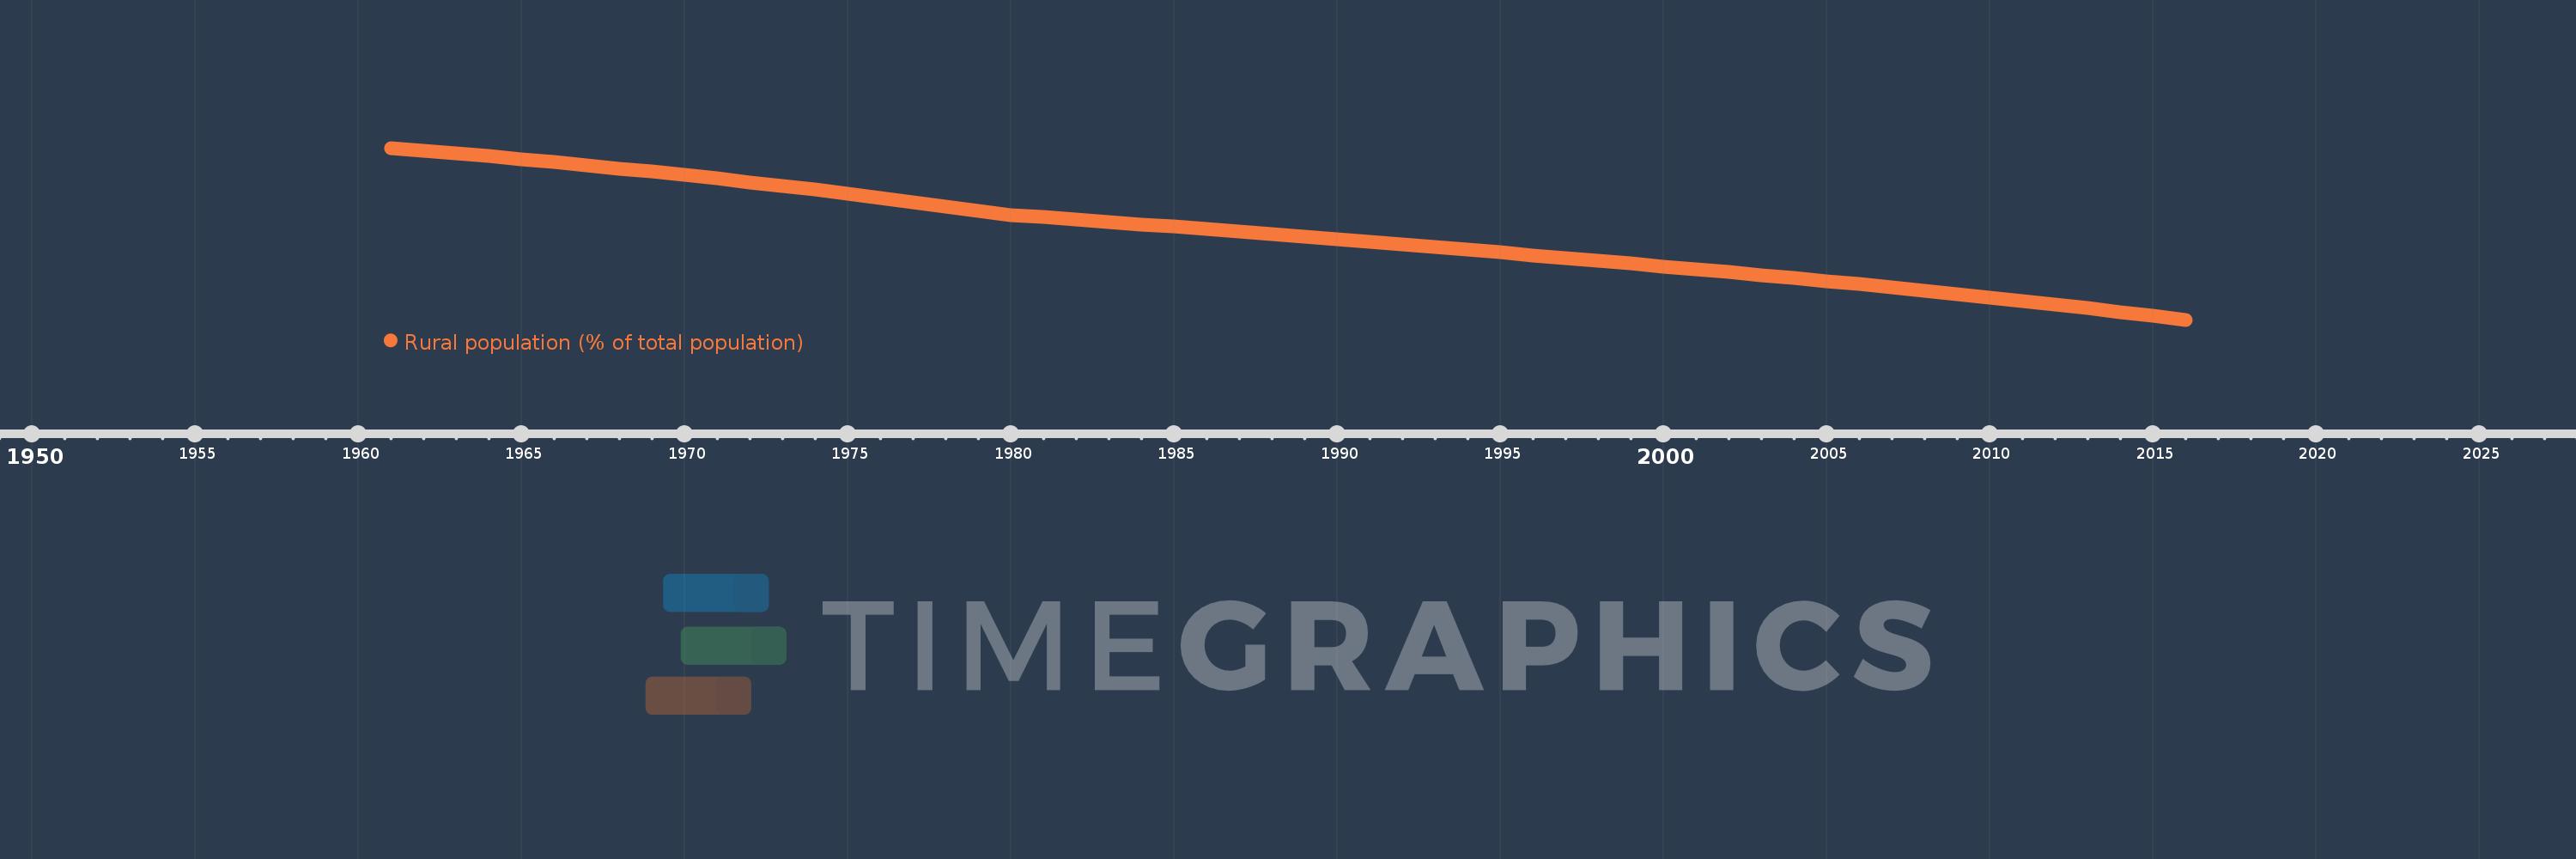
Rural population (% of total population)
2016,2015,2014,2013,2012,2011,2010,2009,2008,2007,2006,2005,2004,2003,2002,2001,2000,1999,1998,1997,1996,1995,1994,1993,1992,1991,1990,1989,1988,1987,1986,1985,1984,1983,1982,1981,1980,1979,1978,1977,1976,1975,1974,1973,1972,1971,1970,1969,1968,1967,1966,1965,1964,1963,1962,1961
This statistics in other country:
AfghanistanAlbaniaAlgeriaAmerican SamoaAndorraAngolaAntigua and BarbudaArab WorldArgentinaArmeniaArubaAustraliaAustriaAzerbaijanBahamas, TheBahrainBangladeshBarbadosBelarusBelgiumBelizeBeninBermudaBhutanBoliviaBosnia and HerzegovinaBotswanaBrazilBritish Virgin IslandsBrunei DarussalamBulgariaBurkina FasoBurundiCabo VerdeCambodiaCameroonCanadaCaribbean small statesCayman IslandsCentral African RepublicCentral Europe and the BalticsChadChannel IslandsChileChinaColombiaComorosCongo, Dem. Rep.Congo, Rep.Costa RicaCote d'IvoireCroatiaCubaCuracaoCyprusCzech RepublicDenmarkDjiboutiDominicaDominican RepublicEarly-demographic dividendEast Asia & PacificEast Asia & Pacific (excluding high income)East Asia & Pacific (IDA & IBRD countries)EcuadorEgypt, Arab Rep.El SalvadorEquatorial GuineaEritreaEstoniaEthiopiaEuro areaEurope & Central AsiaEurope & Central Asia (excluding high income)Europe & Central Asia (IDA & IBRD countries)European UnionFaroe IslandsFijiFinlandFragile and conflict affected situationsFranceFrench PolynesiaGabonGambia, TheGeorgiaGermanyGhanaGibraltarGreeceGreenlandGrenadaGuamGuatemalaGuineaGuinea-BissauGuyanaHaitiHeavily indebted poor countries (HIPC)High incomeHondurasHong Kong SAR, ChinaHungaryIBRD onlyIcelandIDA & IBRD totalIDA blendIDA onlyIDA totalIndiaIndonesiaIran, Islamic Rep.IraqIrelandIsle of ManIsraelItalyJamaicaJapanJordanKazakhstanKenyaKiribatiKorea, Dem. People’s Rep.Korea, Rep.KuwaitKyrgyz RepublicLao PDRLate-demographic dividendLatin America & Caribbean Latin America & Caribbean (excluding high income)Latin America & the Caribbean (IDA & IBRD countries)LatviaLeast developed countries: UN classificationLebanonLesothoLiberiaLibyaLiechtensteinLithuaniaLow & middle incomeLow incomeLower middle incomeLuxembourgMacao SAR, ChinaMacedonia, FYRMadagascarMalawiMalaysiaMaldivesMaliMaltaMarshall IslandsMauritaniaMauritiusMexicoMicronesia, Fed. Sts.Middle East & North AfricaMiddle East & North Africa (excluding high income)Middle East & North Africa (IDA & IBRD countries)Middle incomeMoldovaMonacoMongoliaMontenegroMoroccoMozambiqueMyanmarNamibiaNauruNepalNetherlandsNew CaledoniaNew ZealandNicaraguaNigerNigeriaNorth AmericaNorthern Mariana IslandsNorwayOECD membersOmanOther small statesPacific island small statesPakistanPalauPanamaPapua New GuineaParaguayPeruPhilippinesPolandPortugalPost-demographic dividendPre-demographic dividendPuerto RicoQatarRomaniaRussian FederationRwandaSamoaSan MarinoSao Tome and PrincipeSaudi ArabiaSenegalSerbiaSeychellesSierra LeoneSingaporeSint Maarten (Dutch part)Slovak RepublicSloveniaSmall statesSolomon IslandsSomaliaSouth AfricaSouth AsiaSouth Asia (IDA & IBRD)South SudanSpainSri LankaSt. Kitts and NevisSt. LuciaSt. Vincent and the GrenadinesSub-Saharan Africa Sub-Saharan Africa (excluding high income)Sub-Saharan Africa (IDA & IBRD countries)SudanSurinameSwazilandSwedenSwitzerlandSyrian Arab RepublicTajikistanTanzaniaThailandTimor-LesteTogoTongaTrinidad and TobagoTunisiaTurkeyTurkmenistanTurks and Caicos IslandsTuvaluUgandaUkraineUnited Arab EmiratesUnited KingdomUnited StatesUpper middle incomeUruguayUzbekistanVanuatuVenezuela, RBVietnamVirgin Islands (U.S.)West Bank and GazaWorldYemen, Rep.ZambiaZimbabwe Timeline:
This timeline shows a graph from 1961 to 2016 of Afghanistan. No data until 1960. Number of actual observations by date: 56.
Source name:
World Development Indicators
Source organization:
World Bank Staff estimates based on United Nations, World Urbanization Prospects.
Categories, topics:
Agriculture & Rural Development
Last updated:
apr 23, 2017
Indicators value changes by year
Minimum:
73.297
jan 1, 2016
Maximum:
91.779
jan 1, 1961
At the date of observation
Value
Absolute change
Change from previous value
jan 1, 1961
91.779
+91.779
0.0%
jan 1, 1962
91.492
-0.287
-0.31%
jan 1, 1963
91.195
-0.297
-0.32%
jan 1, 1964
90.89
-0.305
-0.33%
jan 1, 1965
90.574
-0.316
-0.35%
jan 1, 1966
90.25
-0.324
-0.36%
jan 1, 1967
89.915
-0.335
-0.37%
jan 1, 1968
89.57
-0.345
-0.38%
jan 1, 1969
89.214
-0.356
-0.4%
jan 1, 1970
88.848
-0.366
-0.41%
jan 1, 1971
88.471
-0.377
-0.42%
jan 1, 1972
88.083
-0.388
-0.44%
jan 1, 1973
87.684
-0.399
-0.45%
jan 1, 1974
87.274
-0.41
-0.47%
jan 1, 1975
86.851
-0.423
-0.48%
jan 1, 1976
86.417
-0.434
-0.5%
jan 1, 1977
85.971
-0.446
-0.52%
jan 1, 1978
85.513
-0.458
-0.53%
jan 1, 1979
85.042
-0.471
-0.55%
jan 1, 1980
84.565
-0.477
-0.56%
jan 1, 1981
84.319
-0.246
-0.29%
jan 1, 1982
84.07
-0.249
-0.3%
jan 1, 1983
83.818
-0.252
-0.3%
jan 1, 1984
83.563
-0.255
-0.3%
jan 1, 1985
83.304
-0.259
-0.31%
jan 1, 1986
83.042
-0.262
-0.31%
jan 1, 1987
82.777
-0.265
-0.32%
jan 1, 1988
82.509
-0.268
-0.32%
jan 1, 1989
82.237
-0.272
-0.33%
jan 1, 1990
81.962
-0.275
-0.33%
jan 1, 1991
81.684
-0.278
-0.34%
jan 1, 1992
81.403
-0.281
-0.34%
jan 1, 1993
81.118
-0.285
-0.35%
jan 1, 1994
80.83
-0.288
-0.36%
jan 1, 1995
80.538
-0.292
-0.36%
jan 1, 1996
80.243
-0.295
-0.37%
jan 1, 1997
79.945
-0.298
-0.37%
jan 1, 1998
79.644
-0.301
-0.38%
jan 1, 1999
79.339
-0.305
-0.38%
jan 1, 2000
79.03
-0.309
-0.39%
jan 1, 2001
78.718
-0.312
-0.39%
jan 1, 2002
78.404
-0.314
-0.4%
jan 1, 2003
78.085
-0.319
-0.41%
jan 1, 2004
77.763
-0.322
-0.41%
jan 1, 2005
77.438
-0.325
-0.42%
jan 1, 2006
77.105
-0.333
-0.43%
jan 1, 2007
76.763
-0.342
-0.44%
jan 1, 2008
76.413
-0.35
-0.46%
jan 1, 2009
76.054
-0.359
-0.47%
jan 1, 2010
75.687
-0.367
-0.48%
jan 1, 2011
75.311
-0.376
-0.5%
jan 1, 2012
74.926
-0.385
-0.51%
jan 1, 2013
74.532
-0.394
-0.53%
jan 1, 2014
74.129
-0.403
-0.54%
jan 1, 2015
73.718
-0.411
-0.55%
jan 1, 2016
73.297
-0.421
-0.57%
Ranking of countries by current statistics by years


Comments: