29
/
en
AIzaSyAYiBZKx7MnpbEhh9jyipgxe19OcubqV5w
April 1, 2024
153978
Iceland
ISL
true
2
1
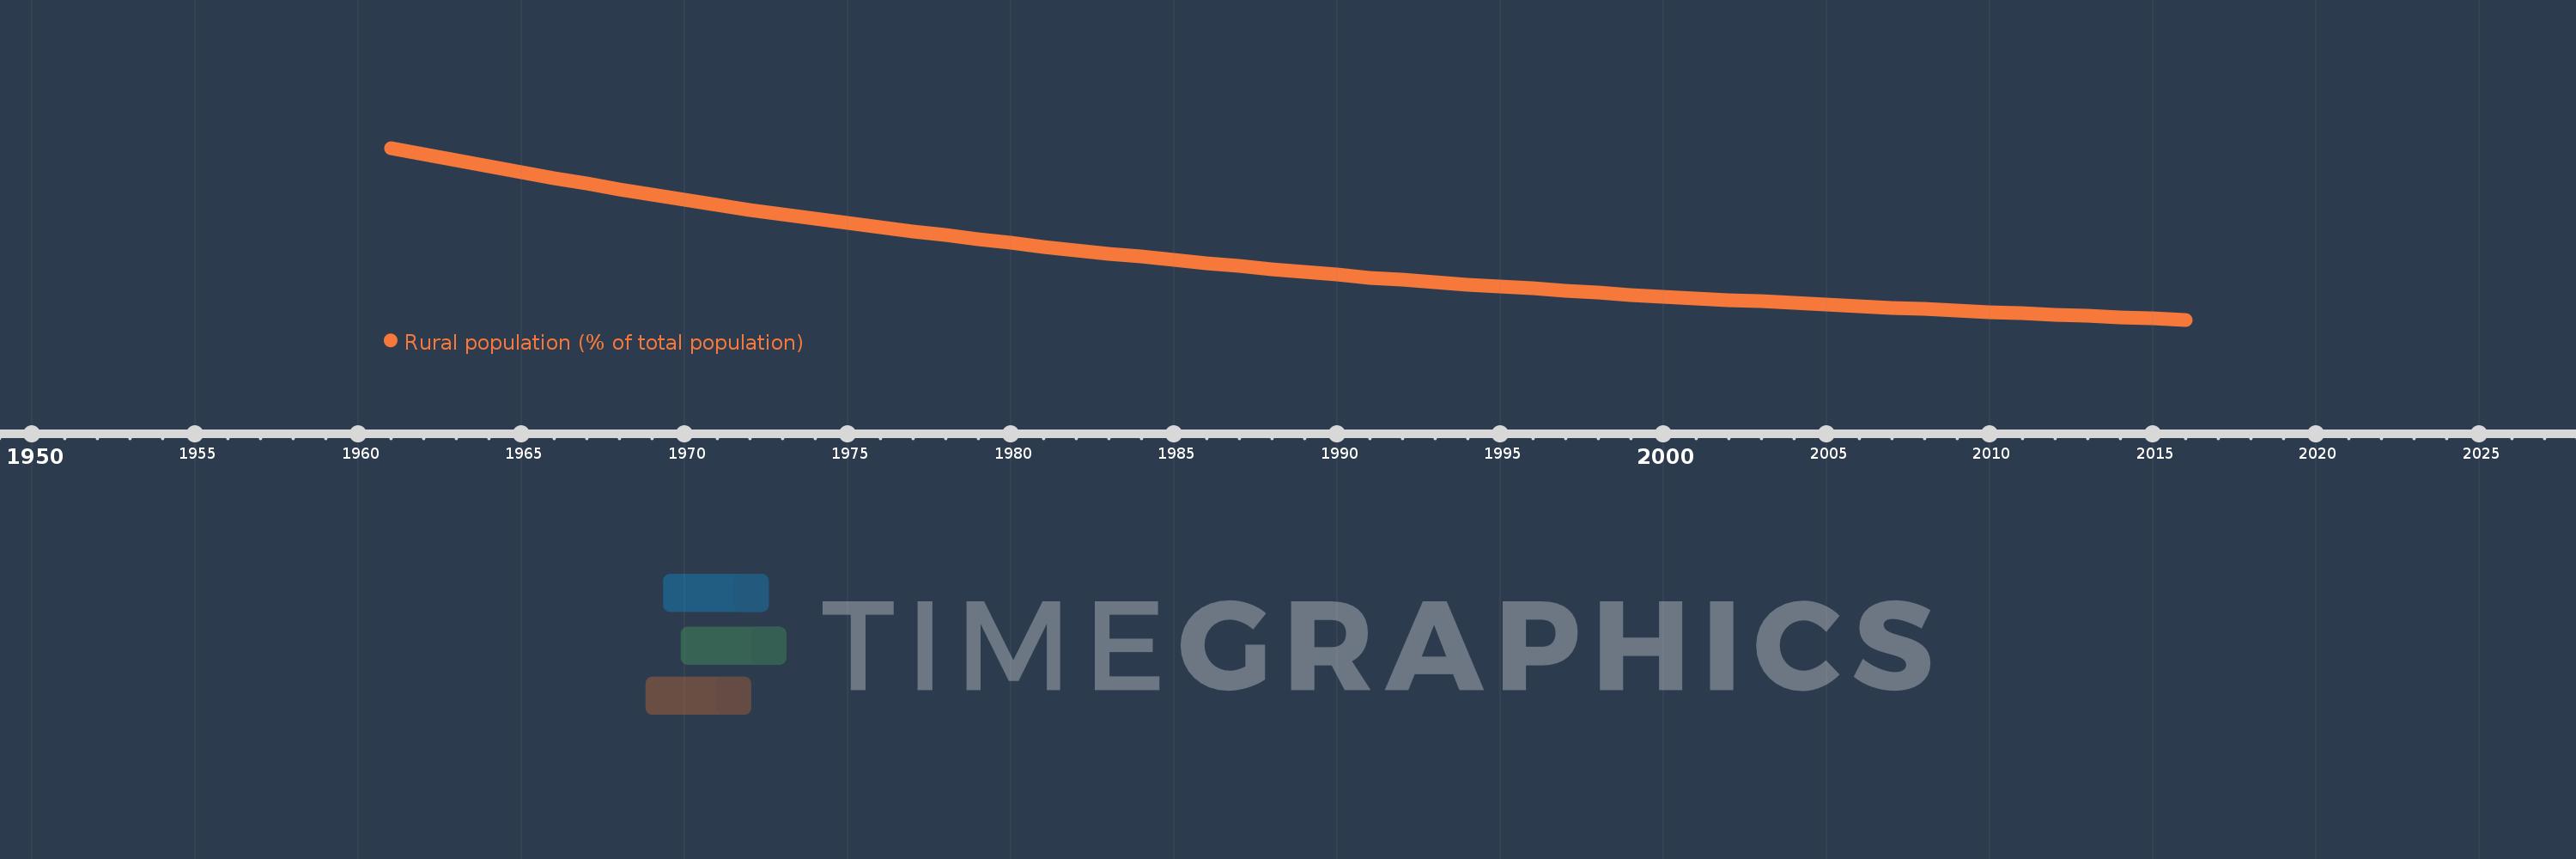
Rural population (% of total population)
2016,2015,2014,2013,2012,2011,2010,2009,2008,2007,2006,2005,2004,2003,2002,2001,2000,1999,1998,1997,1996,1995,1994,1993,1992,1991,1990,1989,1988,1987,1986,1985,1984,1983,1982,1981,1980,1979,1978,1977,1976,1975,1974,1973,1972,1971,1970,1969,1968,1967,1966,1965,1964,1963,1962,1961
This statistics in other country:
AfghanistanAlbaniaAlgeriaAmerican SamoaAndorraAngolaAntigua and BarbudaArab WorldArgentinaArmeniaArubaAustraliaAustriaAzerbaijanBahamas, TheBahrainBangladeshBarbadosBelarusBelgiumBelizeBeninBermudaBhutanBoliviaBosnia and HerzegovinaBotswanaBrazilBritish Virgin IslandsBrunei DarussalamBulgariaBurkina FasoBurundiCabo VerdeCambodiaCameroonCanadaCaribbean small statesCayman IslandsCentral African RepublicCentral Europe and the BalticsChadChannel IslandsChileChinaColombiaComorosCongo, Dem. Rep.Congo, Rep.Costa RicaCote d'IvoireCroatiaCubaCuracaoCyprusCzech RepublicDenmarkDjiboutiDominicaDominican RepublicEarly-demographic dividendEast Asia & PacificEast Asia & Pacific (excluding high income)East Asia & Pacific (IDA & IBRD countries)EcuadorEgypt, Arab Rep.El SalvadorEquatorial GuineaEritreaEstoniaEthiopiaEuro areaEurope & Central AsiaEurope & Central Asia (excluding high income)Europe & Central Asia (IDA & IBRD countries)European UnionFaroe IslandsFijiFinlandFragile and conflict affected situationsFranceFrench PolynesiaGabonGambia, TheGeorgiaGermanyGhanaGibraltarGreeceGreenlandGrenadaGuamGuatemalaGuineaGuinea-BissauGuyanaHaitiHeavily indebted poor countries (HIPC)High incomeHondurasHong Kong SAR, ChinaHungaryIBRD onlyIcelandIDA & IBRD totalIDA blendIDA onlyIDA totalIndiaIndonesiaIran, Islamic Rep.IraqIrelandIsle of ManIsraelItalyJamaicaJapanJordanKazakhstanKenyaKiribatiKorea, Dem. People’s Rep.Korea, Rep.KuwaitKyrgyz RepublicLao PDRLate-demographic dividendLatin America & Caribbean Latin America & Caribbean (excluding high income)Latin America & the Caribbean (IDA & IBRD countries)LatviaLeast developed countries: UN classificationLebanonLesothoLiberiaLibyaLiechtensteinLithuaniaLow & middle incomeLow incomeLower middle incomeLuxembourgMacao SAR, ChinaMacedonia, FYRMadagascarMalawiMalaysiaMaldivesMaliMaltaMarshall IslandsMauritaniaMauritiusMexicoMicronesia, Fed. Sts.Middle East & North AfricaMiddle East & North Africa (excluding high income)Middle East & North Africa (IDA & IBRD countries)Middle incomeMoldovaMonacoMongoliaMontenegroMoroccoMozambiqueMyanmarNamibiaNauruNepalNetherlandsNew CaledoniaNew ZealandNicaraguaNigerNigeriaNorth AmericaNorthern Mariana IslandsNorwayOECD membersOmanOther small statesPacific island small statesPakistanPalauPanamaPapua New GuineaParaguayPeruPhilippinesPolandPortugalPost-demographic dividendPre-demographic dividendPuerto RicoQatarRomaniaRussian FederationRwandaSamoaSan MarinoSao Tome and PrincipeSaudi ArabiaSenegalSerbiaSeychellesSierra LeoneSingaporeSint Maarten (Dutch part)Slovak RepublicSloveniaSmall statesSolomon IslandsSomaliaSouth AfricaSouth AsiaSouth Asia (IDA & IBRD)South SudanSpainSri LankaSt. Kitts and NevisSt. LuciaSt. Vincent and the GrenadinesSub-Saharan Africa Sub-Saharan Africa (excluding high income)Sub-Saharan Africa (IDA & IBRD countries)SudanSurinameSwazilandSwedenSwitzerlandSyrian Arab RepublicTajikistanTanzaniaThailandTimor-LesteTogoTongaTrinidad and TobagoTunisiaTurkeyTurkmenistanTurks and Caicos IslandsTuvaluUgandaUkraineUnited Arab EmiratesUnited KingdomUnited StatesUpper middle incomeUruguayUzbekistanVanuatuVenezuela, RBVietnamVirgin Islands (U.S.)West Bank and GazaWorldYemen, Rep.ZambiaZimbabwe Timeline:
This timeline shows a graph from 1961 to 2016 of Iceland. No data until 1960. Number of actual observations by date: 56.
Source name:
World Development Indicators
Source organization:
World Bank Staff estimates based on United Nations, World Urbanization Prospects.
Categories, topics:
Agriculture & Rural Development
Last updated:
apr 23, 2017
Indicators value changes by year
At the date of observation
Value
Absolute change
Change from previous value
jan 1, 1961
19.7
+19.7
0.0%
jan 1, 1962
19.197
-0.503
-2.55%
jan 1, 1963
18.703
-0.494
-2.57%
jan 1, 1964
18.219
-0.484
-2.59%
jan 1, 1965
17.744
-0.475
-2.61%
jan 1, 1966
17.28
-0.464
-2.61%
jan 1, 1967
16.825
-0.455
-2.63%
jan 1, 1968
16.379
-0.446
-2.65%
jan 1, 1969
15.943
-0.436
-2.66%
jan 1, 1970
15.517
-0.426
-2.67%
jan 1, 1971
15.1
-0.417
-2.69%
jan 1, 1972
14.731
-0.369
-2.44%
jan 1, 1973
14.37
-0.361
-2.45%
jan 1, 1974
14.017
-0.353
-2.46%
jan 1, 1975
13.67
-0.347
-2.48%
jan 1, 1976
13.331
-0.339
-2.48%
jan 1, 1977
12.998
-0.333
-2.5%
jan 1, 1978
12.674
-0.324
-2.49%
jan 1, 1979
12.356
-0.318
-2.51%
jan 1, 1980
12.045
-0.311
-2.52%
jan 1, 1981
11.74
-0.305
-2.53%
jan 1, 1982
11.467
-0.273
-2.33%
jan 1, 1983
11.2
-0.267
-2.33%
jan 1, 1984
10.938
-0.262
-2.34%
jan 1, 1985
10.681
-0.257
-2.35%
jan 1, 1986
10.43
-0.251
-2.35%
jan 1, 1987
10.184
-0.246
-2.36%
jan 1, 1988
9.943
-0.241
-2.37%
jan 1, 1989
9.706
-0.237
-2.38%
jan 1, 1990
9.476
-0.23
-2.37%
jan 1, 1991
9.25
-0.226
-2.38%
jan 1, 1992
9.068
-0.182
-1.97%
jan 1, 1993
8.888
-0.18
-1.99%
jan 1, 1994
8.713
-0.175
-1.97%
jan 1, 1995
8.54
-0.173
-1.99%
jan 1, 1996
8.37
-0.17
-1.99%
jan 1, 1997
8.203
-0.167
-2.0%
jan 1, 1998
8.04
-0.163
-1.99%
jan 1, 1999
7.879
-0.161
-2.0%
jan 1, 2000
7.733
-0.146
-1.85%
jan 1, 2001
7.599
-0.134
-1.73%
jan 1, 2002
7.468
-0.131
-1.72%
jan 1, 2003
7.338
-0.13
-1.74%
jan 1, 2004
7.211
-0.127
-1.73%
jan 1, 2005
7.086
-0.125
-1.73%
jan 1, 2006
6.963
-0.123
-1.74%
jan 1, 2007
6.841
-0.122
-1.75%
jan 1, 2008
6.722
-0.119
-1.74%
jan 1, 2009
6.605
-0.117
-1.74%
jan 1, 2010
6.489
-0.116
-1.76%
jan 1, 2011
6.376
-0.113
-1.74%
jan 1, 2012
6.266
-0.11
-1.73%
jan 1, 2013
6.16
-0.106
-1.69%
jan 1, 2014
6.058
-0.102
-1.66%
jan 1, 2015
5.958
-0.1
-1.65%
jan 1, 2016
5.863
-0.095
-1.59%
Ranking of countries by current statistics by years


Comments: