29
/
en
AIzaSyAYiBZKx7MnpbEhh9jyipgxe19OcubqV5w
April 1, 2024
267368
Trinidad and Tobago
TTO
true
2
1
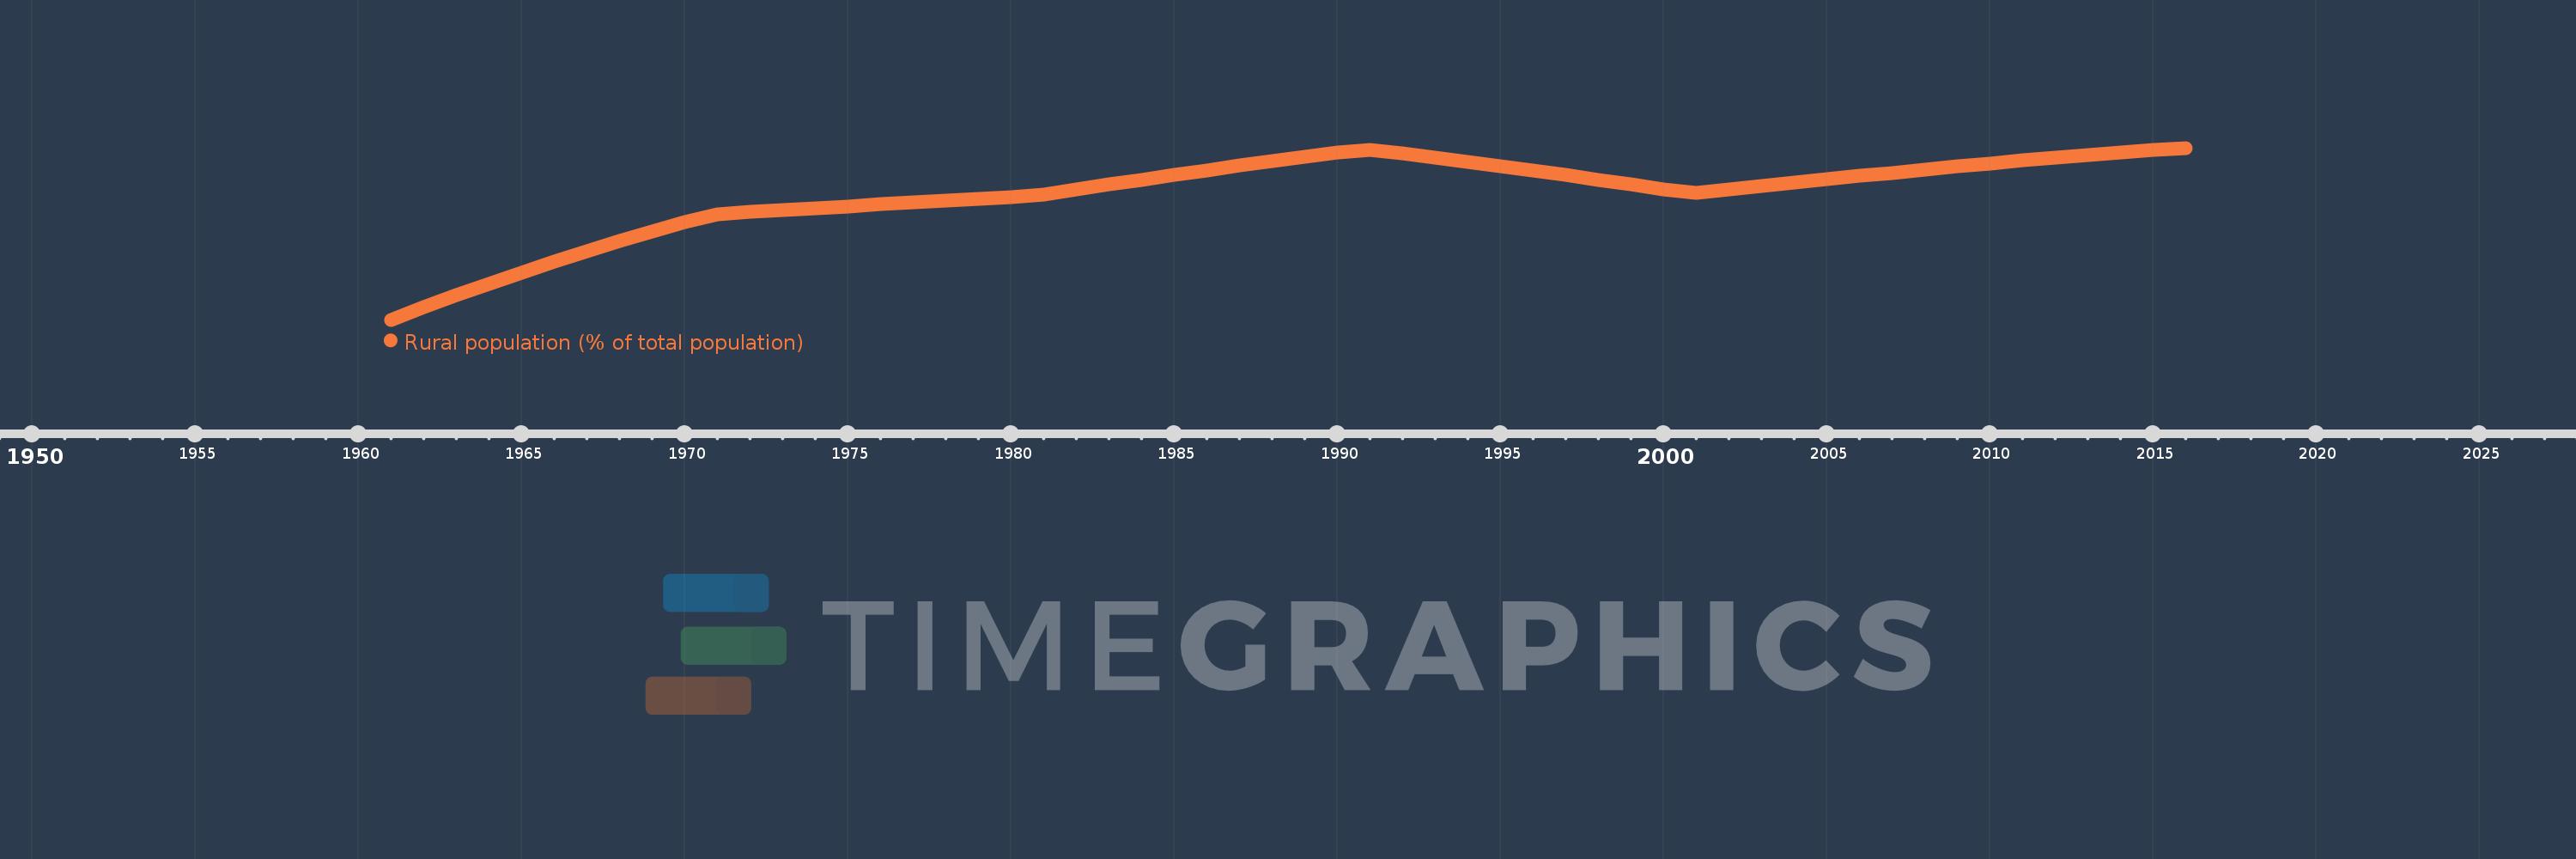
Rural population (% of total population)
2016,2015,2014,2013,2012,2011,2010,2009,2008,2007,2006,2005,2004,2003,2002,2001,2000,1999,1998,1997,1996,1995,1994,1993,1992,1991,1990,1989,1988,1987,1986,1985,1984,1983,1982,1981,1980,1979,1978,1977,1976,1975,1974,1973,1972,1971,1970,1969,1968,1967,1966,1965,1964,1963,1962,1961
This statistics in other country:
AfghanistanAlbaniaAlgeriaAmerican SamoaAndorraAngolaAntigua and BarbudaArab WorldArgentinaArmeniaArubaAustraliaAustriaAzerbaijanBahamas, TheBahrainBangladeshBarbadosBelarusBelgiumBelizeBeninBermudaBhutanBoliviaBosnia and HerzegovinaBotswanaBrazilBritish Virgin IslandsBrunei DarussalamBulgariaBurkina FasoBurundiCabo VerdeCambodiaCameroonCanadaCaribbean small statesCayman IslandsCentral African RepublicCentral Europe and the BalticsChadChannel IslandsChileChinaColombiaComorosCongo, Dem. Rep.Congo, Rep.Costa RicaCote d'IvoireCroatiaCubaCuracaoCyprusCzech RepublicDenmarkDjiboutiDominicaDominican RepublicEarly-demographic dividendEast Asia & PacificEast Asia & Pacific (excluding high income)East Asia & Pacific (IDA & IBRD countries)EcuadorEgypt, Arab Rep.El SalvadorEquatorial GuineaEritreaEstoniaEthiopiaEuro areaEurope & Central AsiaEurope & Central Asia (excluding high income)Europe & Central Asia (IDA & IBRD countries)European UnionFaroe IslandsFijiFinlandFragile and conflict affected situationsFranceFrench PolynesiaGabonGambia, TheGeorgiaGermanyGhanaGibraltarGreeceGreenlandGrenadaGuamGuatemalaGuineaGuinea-BissauGuyanaHaitiHeavily indebted poor countries (HIPC)High incomeHondurasHong Kong SAR, ChinaHungaryIBRD onlyIcelandIDA & IBRD totalIDA blendIDA onlyIDA totalIndiaIndonesiaIran, Islamic Rep.IraqIrelandIsle of ManIsraelItalyJamaicaJapanJordanKazakhstanKenyaKiribatiKorea, Dem. People’s Rep.Korea, Rep.KuwaitKyrgyz RepublicLao PDRLate-demographic dividendLatin America & Caribbean Latin America & Caribbean (excluding high income)Latin America & the Caribbean (IDA & IBRD countries)LatviaLeast developed countries: UN classificationLebanonLesothoLiberiaLibyaLiechtensteinLithuaniaLow & middle incomeLow incomeLower middle incomeLuxembourgMacao SAR, ChinaMacedonia, FYRMadagascarMalawiMalaysiaMaldivesMaliMaltaMarshall IslandsMauritaniaMauritiusMexicoMicronesia, Fed. Sts.Middle East & North AfricaMiddle East & North Africa (excluding high income)Middle East & North Africa (IDA & IBRD countries)Middle incomeMoldovaMonacoMongoliaMontenegroMoroccoMozambiqueMyanmarNamibiaNauruNepalNetherlandsNew CaledoniaNew ZealandNicaraguaNigerNigeriaNorth AmericaNorthern Mariana IslandsNorwayOECD membersOmanOther small statesPacific island small statesPakistanPalauPanamaPapua New GuineaParaguayPeruPhilippinesPolandPortugalPost-demographic dividendPre-demographic dividendPuerto RicoQatarRomaniaRussian FederationRwandaSamoaSan MarinoSao Tome and PrincipeSaudi ArabiaSenegalSerbiaSeychellesSierra LeoneSingaporeSint Maarten (Dutch part)Slovak RepublicSloveniaSmall statesSolomon IslandsSomaliaSouth AfricaSouth AsiaSouth Asia (IDA & IBRD)South SudanSpainSri LankaSt. Kitts and NevisSt. LuciaSt. Vincent and the GrenadinesSub-Saharan Africa Sub-Saharan Africa (excluding high income)Sub-Saharan Africa (IDA & IBRD countries)SudanSurinameSwazilandSwedenSwitzerlandSyrian Arab RepublicTajikistanTanzaniaThailandTimor-LesteTogoTongaTrinidad and TobagoTunisiaTurkeyTurkmenistanTurks and Caicos IslandsTuvaluUgandaUkraineUnited Arab EmiratesUnited KingdomUnited StatesUpper middle incomeUruguayUzbekistanVanuatuVenezuela, RBVietnamVirgin Islands (U.S.)West Bank and GazaWorldYemen, Rep.ZambiaZimbabwe Timeline:
This timeline shows a graph from 1961 to 2016 of Trinidad and Tobago. No data until 1960. Number of actual observations by date: 56.
Source name:
World Development Indicators
Source organization:
World Bank Staff estimates based on United Nations, World Urbanization Prospects.
Categories, topics:
Agriculture & Rural Development
Last updated:
apr 23, 2017
Indicators value changes by year
Minimum:
82.651
jan 1, 1961
Maximum:
91.555
jan 1, 2016
At the date of observation
Value
Absolute change
Change from previous value
jan 1, 1961
82.651
+82.651
0.0%
jan 1, 1962
83.288
+0.637
0.77%
jan 1, 1963
83.907
+0.619
0.74%
jan 1, 1964
84.507
+0.6
0.72%
jan 1, 1965
85.09
+0.583
0.69%
jan 1, 1966
85.653
+0.563
0.66%
jan 1, 1967
86.199
+0.546
0.64%
jan 1, 1968
86.727
+0.528
0.61%
jan 1, 1969
87.239
+0.512
0.59%
jan 1, 1970
87.732
+0.493
0.57%
jan 1, 1971
88.124
+0.392
0.45%
jan 1, 1972
88.226
+0.102
0.12%
jan 1, 1973
88.328
+0.102
0.12%
jan 1, 1974
88.429
+0.101
0.11%
jan 1, 1975
88.529
+0.1
0.11%
jan 1, 1976
88.628
+0.099
0.11%
jan 1, 1977
88.726
+0.098
0.11%
jan 1, 1978
88.824
+0.098
0.11%
jan 1, 1979
88.921
+0.097
0.11%
jan 1, 1980
89.017
+0.096
0.11%
jan 1, 1981
89.137
+0.12
0.13%
jan 1, 1982
89.401
+0.264
0.3%
jan 1, 1983
89.659
+0.258
0.29%
jan 1, 1984
89.913
+0.254
0.28%
jan 1, 1985
90.161
+0.248
0.28%
jan 1, 1986
90.403
+0.242
0.27%
jan 1, 1987
90.639
+0.236
0.26%
jan 1, 1988
90.871
+0.232
0.26%
jan 1, 1989
91.098
+0.227
0.25%
jan 1, 1990
91.319
+0.221
0.24%
jan 1, 1991
91.466
+0.147
0.16%
jan 1, 1992
91.258
-0.208
-0.23%
jan 1, 1993
91.045
-0.213
-0.23%
jan 1, 1994
90.827
-0.218
-0.24%
jan 1, 1995
90.605
-0.222
-0.24%
jan 1, 1996
90.378
-0.227
-0.25%
jan 1, 1997
90.146
-0.232
-0.26%
jan 1, 1998
89.909
-0.237
-0.26%
jan 1, 1999
89.667
-0.242
-0.27%
jan 1, 2000
89.42
-0.247
-0.28%
jan 1, 2001
89.223
-0.197
-0.22%
jan 1, 2002
89.403
+0.18
0.2%
jan 1, 2003
89.581
+0.178
0.2%
jan 1, 2004
89.756
+0.175
0.2%
jan 1, 2005
89.928
+0.172
0.19%
jan 1, 2006
90.098
+0.17
0.19%
jan 1, 2007
90.265
+0.167
0.19%
jan 1, 2008
90.429
+0.164
0.18%
jan 1, 2009
90.592
+0.163
0.18%
jan 1, 2010
90.751
+0.159
0.18%
jan 1, 2011
90.908
+0.157
0.17%
jan 1, 2012
91.063
+0.155
0.17%
jan 1, 2013
91.205
+0.142
0.16%
jan 1, 2014
91.334
+0.129
0.14%
jan 1, 2015
91.45
+0.116
0.13%
jan 1, 2016
91.555
+0.105
0.11%
Ranking of countries by current statistics by years


Comments: