29
/
en
AIzaSyAYiBZKx7MnpbEhh9jyipgxe19OcubqV5w
April 1, 2024
68375
Angola
AGO
true
2
1
Rural population (% of total population)
2016,2015,2014,2013,2012,2011,2010,2009,2008,2007,2006,2005,2004,2003,2002,2001,2000,1999,1998,1997,1996,1995,1994,1993,1992,1991,1990,1989,1988,1987,1986,1985,1984,1983,1982,1981,1980,1979,1978,1977,1976,1975,1974,1973,1972,1971,1970,1969,1968,1967,1966,1965,1964,1963,1962,1961
This statistics in other country:
AfghanistanAlbaniaAlgeriaAmerican SamoaAndorraAngolaAntigua and BarbudaArab WorldArgentinaArmeniaArubaAustraliaAustriaAzerbaijanBahamas, TheBahrainBangladeshBarbadosBelarusBelgiumBelizeBeninBermudaBhutanBoliviaBosnia and HerzegovinaBotswanaBrazilBritish Virgin IslandsBrunei DarussalamBulgariaBurkina FasoBurundiCabo VerdeCambodiaCameroonCanadaCaribbean small statesCayman IslandsCentral African RepublicCentral Europe and the BalticsChadChannel IslandsChileChinaColombiaComorosCongo, Dem. Rep.Congo, Rep.Costa RicaCote d'IvoireCroatiaCubaCuracaoCyprusCzech RepublicDenmarkDjiboutiDominicaDominican RepublicEarly-demographic dividendEast Asia & PacificEast Asia & Pacific (excluding high income)East Asia & Pacific (IDA & IBRD countries)EcuadorEgypt, Arab Rep.El SalvadorEquatorial GuineaEritreaEstoniaEthiopiaEuro areaEurope & Central AsiaEurope & Central Asia (excluding high income)Europe & Central Asia (IDA & IBRD countries)European UnionFaroe IslandsFijiFinlandFragile and conflict affected situationsFranceFrench PolynesiaGabonGambia, TheGeorgiaGermanyGhanaGibraltarGreeceGreenlandGrenadaGuamGuatemalaGuineaGuinea-BissauGuyanaHaitiHeavily indebted poor countries (HIPC)High incomeHondurasHong Kong SAR, ChinaHungaryIBRD onlyIcelandIDA & IBRD totalIDA blendIDA onlyIDA totalIndiaIndonesiaIran, Islamic Rep.IraqIrelandIsle of ManIsraelItalyJamaicaJapanJordanKazakhstanKenyaKiribatiKorea, Dem. People’s Rep.Korea, Rep.KuwaitKyrgyz RepublicLao PDRLate-demographic dividendLatin America & Caribbean Latin America & Caribbean (excluding high income)Latin America & the Caribbean (IDA & IBRD countries)LatviaLeast developed countries: UN classificationLebanonLesothoLiberiaLibyaLiechtensteinLithuaniaLow & middle incomeLow incomeLower middle incomeLuxembourgMacao SAR, ChinaMacedonia, FYRMadagascarMalawiMalaysiaMaldivesMaliMaltaMarshall IslandsMauritaniaMauritiusMexicoMicronesia, Fed. Sts.Middle East & North AfricaMiddle East & North Africa (excluding high income)Middle East & North Africa (IDA & IBRD countries)Middle incomeMoldovaMonacoMongoliaMontenegroMoroccoMozambiqueMyanmarNamibiaNauruNepalNetherlandsNew CaledoniaNew ZealandNicaraguaNigerNigeriaNorth AmericaNorthern Mariana IslandsNorwayOECD membersOmanOther small statesPacific island small statesPakistanPalauPanamaPapua New GuineaParaguayPeruPhilippinesPolandPortugalPost-demographic dividendPre-demographic dividendPuerto RicoQatarRomaniaRussian FederationRwandaSamoaSan MarinoSao Tome and PrincipeSaudi ArabiaSenegalSerbiaSeychellesSierra LeoneSingaporeSint Maarten (Dutch part)Slovak RepublicSloveniaSmall statesSolomon IslandsSomaliaSouth AfricaSouth AsiaSouth Asia (IDA & IBRD)South SudanSpainSri LankaSt. Kitts and NevisSt. LuciaSt. Vincent and the GrenadinesSub-Saharan Africa Sub-Saharan Africa (excluding high income)Sub-Saharan Africa (IDA & IBRD countries)SudanSurinameSwazilandSwedenSwitzerlandSyrian Arab RepublicTajikistanTanzaniaThailandTimor-LesteTogoTongaTrinidad and TobagoTunisiaTurkeyTurkmenistanTurks and Caicos IslandsTuvaluUgandaUkraineUnited Arab EmiratesUnited KingdomUnited StatesUpper middle incomeUruguayUzbekistanVanuatuVenezuela, RBVietnamVirgin Islands (U.S.)West Bank and GazaWorldYemen, Rep.ZambiaZimbabwe Timeline:
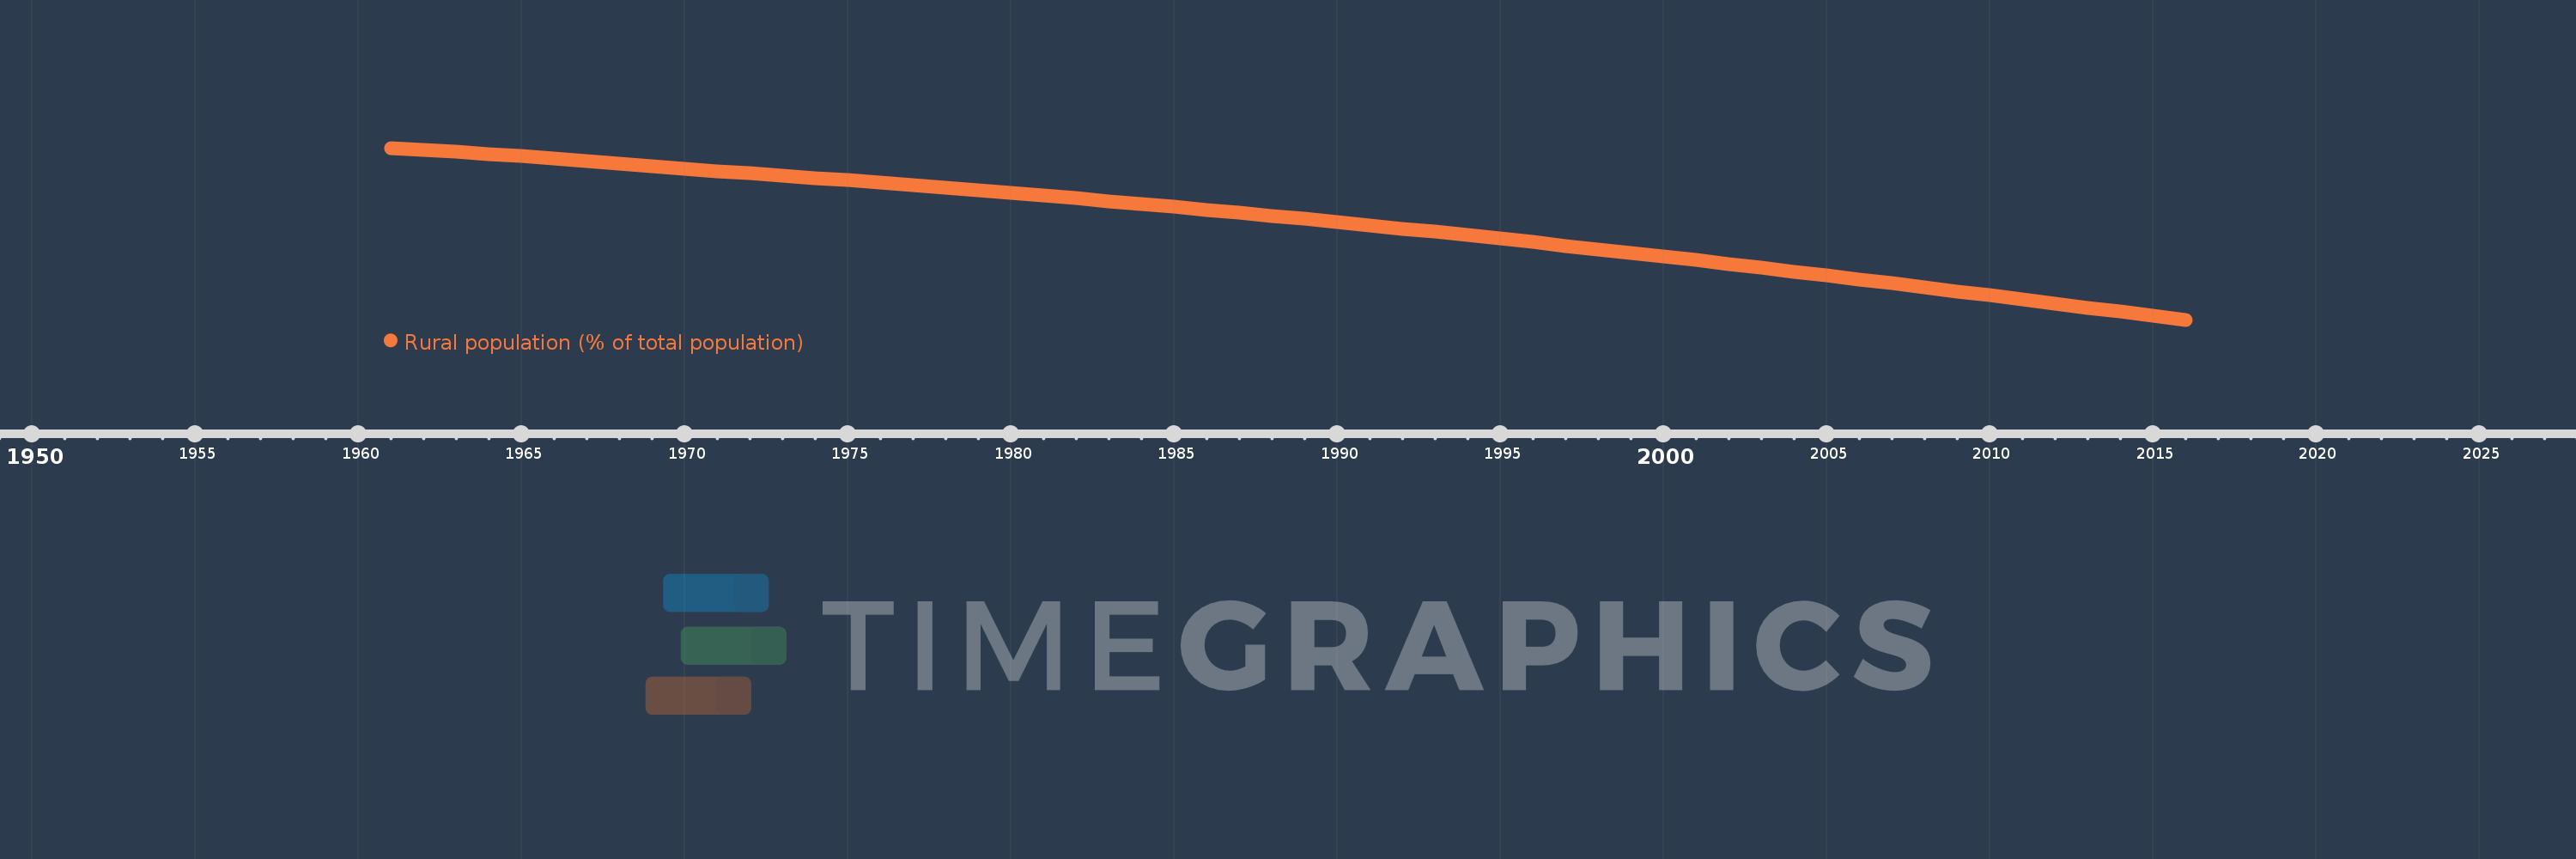
This timeline shows a graph from 1961 to 2016 of Angola. No data until 1960. Number of actual observations by date: 56.
Source name:
World Development Indicators
Source organization:
World Bank Staff estimates based on United Nations, World Urbanization Prospects.
Categories, topics:
Agriculture & Rural Development
Last updated:
apr 23, 2017
Indicators value changes by year
Maximum:
89.565
jan 1, 1961
At the date of observation
Value
Absolute change
Change from previous value
jan 1, 1961
89.565
+89.565
0.0%
jan 1, 1962
89.202
-0.363
-0.41%
jan 1, 1963
88.796
-0.406
-0.46%
jan 1, 1964
88.376
-0.42
-0.47%
jan 1, 1965
87.942
-0.434
-0.49%
jan 1, 1966
87.496
-0.446
-0.51%
jan 1, 1967
87.035
-0.461
-0.53%
jan 1, 1968
86.559
-0.476
-0.55%
jan 1, 1969
86.068
-0.491
-0.57%
jan 1, 1970
85.564
-0.504
-0.59%
jan 1, 1971
85.043
-0.521
-0.61%
jan 1, 1972
84.566
-0.477
-0.56%
jan 1, 1973
84.125
-0.441
-0.52%
jan 1, 1974
83.676
-0.449
-0.53%
jan 1, 1975
83.215
-0.461
-0.55%
jan 1, 1976
82.745
-0.47
-0.56%
jan 1, 1977
82.263
-0.482
-0.58%
jan 1, 1978
81.772
-0.491
-0.6%
jan 1, 1979
81.27
-0.502
-0.61%
jan 1, 1980
80.758
-0.512
-0.63%
jan 1, 1981
80.234
-0.524
-0.65%
jan 1, 1982
79.701
-0.533
-0.66%
jan 1, 1983
79.157
-0.544
-0.68%
jan 1, 1984
78.602
-0.555
-0.7%
jan 1, 1985
78.035
-0.567
-0.72%
jan 1, 1986
77.459
-0.576
-0.74%
jan 1, 1987
76.872
-0.587
-0.76%
jan 1, 1988
76.275
-0.597
-0.78%
jan 1, 1989
75.666
-0.609
-0.8%
jan 1, 1990
75.048
-0.618
-0.82%
jan 1, 1991
74.418
-0.63
-0.84%
jan 1, 1992
73.779
-0.639
-0.86%
jan 1, 1993
73.128
-0.651
-0.88%
jan 1, 1994
72.47
-0.658
-0.9%
jan 1, 1995
71.8
-0.67
-0.92%
jan 1, 1996
71.12
-0.68
-0.95%
jan 1, 1997
70.43
-0.69
-0.97%
jan 1, 1998
69.732
-0.698
-0.99%
jan 1, 1999
69.025
-0.707
-1.01%
jan 1, 2000
68.308
-0.717
-1.04%
jan 1, 2001
67.581
-0.727
-1.06%
jan 1, 2002
66.848
-0.733
-1.08%
jan 1, 2003
66.105
-0.743
-1.11%
jan 1, 2004
65.355
-0.75
-1.13%
jan 1, 2005
64.595
-0.76
-1.16%
jan 1, 2006
63.831
-0.764
-1.18%
jan 1, 2007
63.058
-0.773
-1.21%
jan 1, 2008
62.278
-0.78
-1.24%
jan 1, 2009
61.491
-0.787
-1.26%
jan 1, 2010
60.701
-0.79
-1.28%
jan 1, 2011
59.903
-0.798
-1.31%
jan 1, 2012
59.1
-0.803
-1.34%
jan 1, 2013
58.301
-0.799
-1.35%
jan 1, 2014
57.51
-0.791
-1.36%
jan 1, 2015
56.726
-0.784
-1.36%
jan 1, 2016
55.95
-0.776
-1.37%
Ranking of countries by current statistics by years


Comments: