29
/
en
AIzaSyAYiBZKx7MnpbEhh9jyipgxe19OcubqV5w
April 1, 2024
275194
United Arab Emirates
ARE
true
2
1
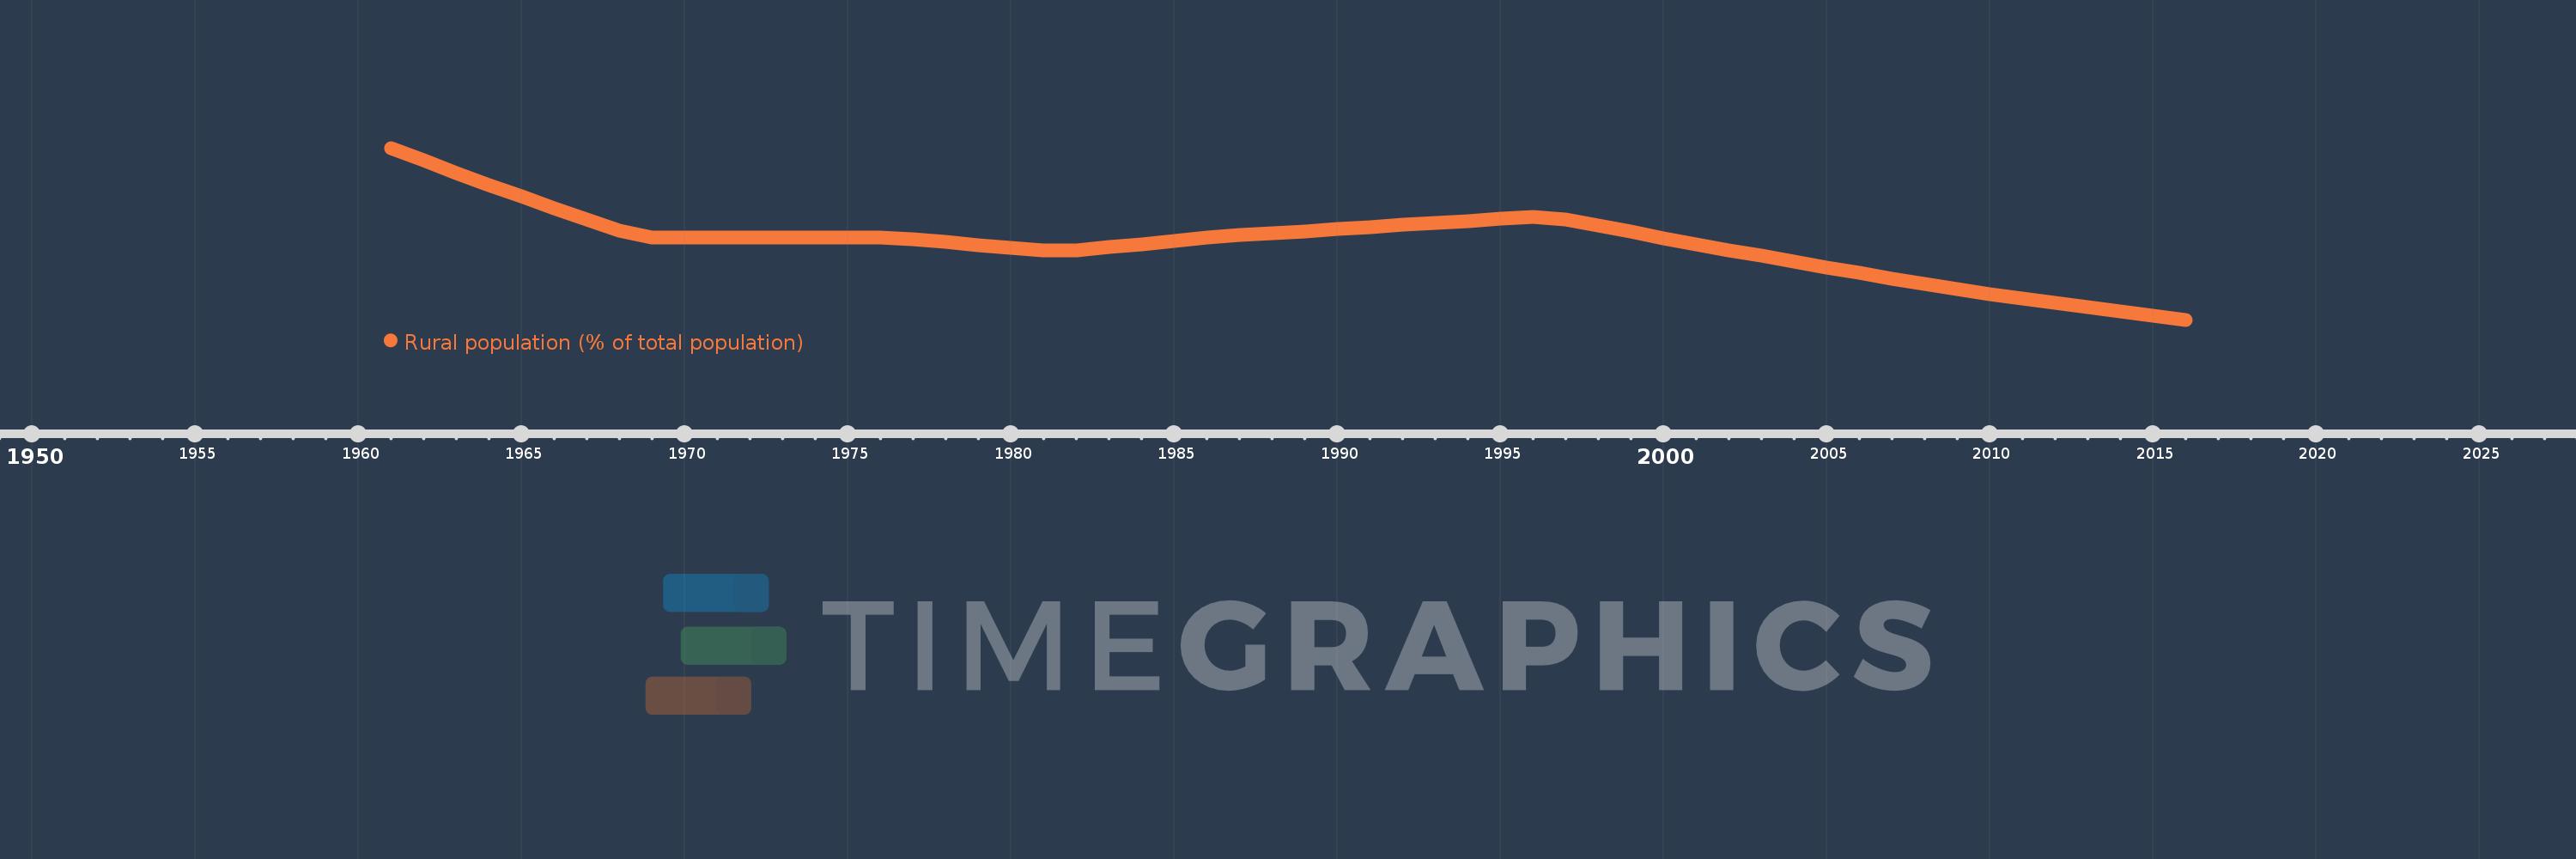
Rural population (% of total population)
2016,2015,2014,2013,2012,2011,2010,2009,2008,2007,2006,2005,2004,2003,2002,2001,2000,1999,1998,1997,1996,1995,1994,1993,1992,1991,1990,1989,1988,1987,1986,1985,1984,1983,1982,1981,1980,1979,1978,1977,1976,1975,1974,1973,1972,1971,1970,1969,1968,1967,1966,1965,1964,1963,1962,1961
This statistics in other country:
AfghanistanAlbaniaAlgeriaAmerican SamoaAndorraAngolaAntigua and BarbudaArab WorldArgentinaArmeniaArubaAustraliaAustriaAzerbaijanBahamas, TheBahrainBangladeshBarbadosBelarusBelgiumBelizeBeninBermudaBhutanBoliviaBosnia and HerzegovinaBotswanaBrazilBritish Virgin IslandsBrunei DarussalamBulgariaBurkina FasoBurundiCabo VerdeCambodiaCameroonCanadaCaribbean small statesCayman IslandsCentral African RepublicCentral Europe and the BalticsChadChannel IslandsChileChinaColombiaComorosCongo, Dem. Rep.Congo, Rep.Costa RicaCote d'IvoireCroatiaCubaCuracaoCyprusCzech RepublicDenmarkDjiboutiDominicaDominican RepublicEarly-demographic dividendEast Asia & PacificEast Asia & Pacific (excluding high income)East Asia & Pacific (IDA & IBRD countries)EcuadorEgypt, Arab Rep.El SalvadorEquatorial GuineaEritreaEstoniaEthiopiaEuro areaEurope & Central AsiaEurope & Central Asia (excluding high income)Europe & Central Asia (IDA & IBRD countries)European UnionFaroe IslandsFijiFinlandFragile and conflict affected situationsFranceFrench PolynesiaGabonGambia, TheGeorgiaGermanyGhanaGibraltarGreeceGreenlandGrenadaGuamGuatemalaGuineaGuinea-BissauGuyanaHaitiHeavily indebted poor countries (HIPC)High incomeHondurasHong Kong SAR, ChinaHungaryIBRD onlyIcelandIDA & IBRD totalIDA blendIDA onlyIDA totalIndiaIndonesiaIran, Islamic Rep.IraqIrelandIsle of ManIsraelItalyJamaicaJapanJordanKazakhstanKenyaKiribatiKorea, Dem. People’s Rep.Korea, Rep.KuwaitKyrgyz RepublicLao PDRLate-demographic dividendLatin America & Caribbean Latin America & Caribbean (excluding high income)Latin America & the Caribbean (IDA & IBRD countries)LatviaLeast developed countries: UN classificationLebanonLesothoLiberiaLibyaLiechtensteinLithuaniaLow & middle incomeLow incomeLower middle incomeLuxembourgMacao SAR, ChinaMacedonia, FYRMadagascarMalawiMalaysiaMaldivesMaliMaltaMarshall IslandsMauritaniaMauritiusMexicoMicronesia, Fed. Sts.Middle East & North AfricaMiddle East & North Africa (excluding high income)Middle East & North Africa (IDA & IBRD countries)Middle incomeMoldovaMonacoMongoliaMontenegroMoroccoMozambiqueMyanmarNamibiaNauruNepalNetherlandsNew CaledoniaNew ZealandNicaraguaNigerNigeriaNorth AmericaNorthern Mariana IslandsNorwayOECD membersOmanOther small statesPacific island small statesPakistanPalauPanamaPapua New GuineaParaguayPeruPhilippinesPolandPortugalPost-demographic dividendPre-demographic dividendPuerto RicoQatarRomaniaRussian FederationRwandaSamoaSan MarinoSao Tome and PrincipeSaudi ArabiaSenegalSerbiaSeychellesSierra LeoneSingaporeSint Maarten (Dutch part)Slovak RepublicSloveniaSmall statesSolomon IslandsSomaliaSouth AfricaSouth AsiaSouth Asia (IDA & IBRD)South SudanSpainSri LankaSt. Kitts and NevisSt. LuciaSt. Vincent and the GrenadinesSub-Saharan Africa Sub-Saharan Africa (excluding high income)Sub-Saharan Africa (IDA & IBRD countries)SudanSurinameSwazilandSwedenSwitzerlandSyrian Arab RepublicTajikistanTanzaniaThailandTimor-LesteTogoTongaTrinidad and TobagoTunisiaTurkeyTurkmenistanTurks and Caicos IslandsTuvaluUgandaUkraineUnited Arab EmiratesUnited KingdomUnited StatesUpper middle incomeUruguayUzbekistanVanuatuVenezuela, RBVietnamVirgin Islands (U.S.)West Bank and GazaWorldYemen, Rep.ZambiaZimbabwe Timeline:
This timeline shows a graph from 1961 to 2016 of United Arab Emirates. No data until 1960. Number of actual observations by date: 56.
Source name:
World Development Indicators
Source organization:
World Bank Staff estimates based on United Nations, World Urbanization Prospects.
Categories, topics:
Agriculture & Rural Development
Last updated:
apr 23, 2017
Indicators value changes by year
Minimum:
14.459
jan 1, 2016
At the date of observation
Value
Absolute change
Change from previous value
jan 1, 1961
26.5
+26.5
0.0%
jan 1, 1962
25.617
-0.883
-3.33%
jan 1, 1963
24.752
-0.865
-3.38%
jan 1, 1964
23.907
-0.845
-3.41%
jan 1, 1965
23.081
-0.826
-3.46%
jan 1, 1966
22.277
-0.804
-3.48%
jan 1, 1967
21.492
-0.785
-3.52%
jan 1, 1968
20.728
-0.764
-3.55%
jan 1, 1969
20.2
-0.528
-2.55%
jan 1, 1977
20.097
-0.103
-0.51%
jan 1, 1978
19.894
-0.203
-1.01%
jan 1, 1979
19.691
-0.203
-1.02%
jan 1, 1980
19.49
-0.201
-1.02%
jan 1, 1981
19.29
-0.2
-1.03%
jan 1, 1982
19.317
+0.027
0.14%
jan 1, 1983
19.534
+0.217
1.12%
jan 1, 1984
19.753
+0.219
1.12%
jan 1, 1985
19.974
+0.221
1.12%
jan 1, 1986
20.196
+0.222
1.11%
jan 1, 1987
20.376
+0.18
0.89%
jan 1, 1988
20.518
+0.142
0.7%
jan 1, 1989
20.661
+0.143
0.7%
jan 1, 1990
20.804
+0.143
0.69%
jan 1, 1991
20.949
+0.145
0.7%
jan 1, 1992
21.094
+0.145
0.69%
jan 1, 1993
21.24
+0.146
0.69%
jan 1, 1994
21.386
+0.146
0.69%
jan 1, 1995
21.533
+0.147
0.69%
jan 1, 1996
21.681
+0.148
0.69%
jan 1, 1997
21.507
-0.174
-0.8%
jan 1, 1998
21.062
-0.445
-2.07%
jan 1, 1999
20.622
-0.44
-2.09%
jan 1, 2000
20.19
-0.432
-2.09%
jan 1, 2001
19.764
-0.426
-2.11%
jan 1, 2002
19.345
-0.419
-2.12%
jan 1, 2003
18.933
-0.412
-2.13%
jan 1, 2004
18.528
-0.405
-2.14%
jan 1, 2005
18.129
-0.399
-2.15%
jan 1, 2006
17.738
-0.391
-2.16%
jan 1, 2007
17.352
-0.386
-2.18%
jan 1, 2008
16.981
-0.371
-2.14%
jan 1, 2009
16.623
-0.358
-2.11%
jan 1, 2010
16.277
-0.346
-2.08%
jan 1, 2011
15.945
-0.332
-2.04%
jan 1, 2012
15.625
-0.32
-2.01%
jan 1, 2013
15.316
-0.309
-1.98%
jan 1, 2014
15.019
-0.297
-1.94%
jan 1, 2015
14.734
-0.285
-1.9%
jan 1, 2016
14.459
-0.275
-1.87%
Ranking of countries by current statistics by years


Comments: