29
/
en
AIzaSyAYiBZKx7MnpbEhh9jyipgxe19OcubqV5w
April 1, 2024
282967
Vietnam
VNM
true
2
1
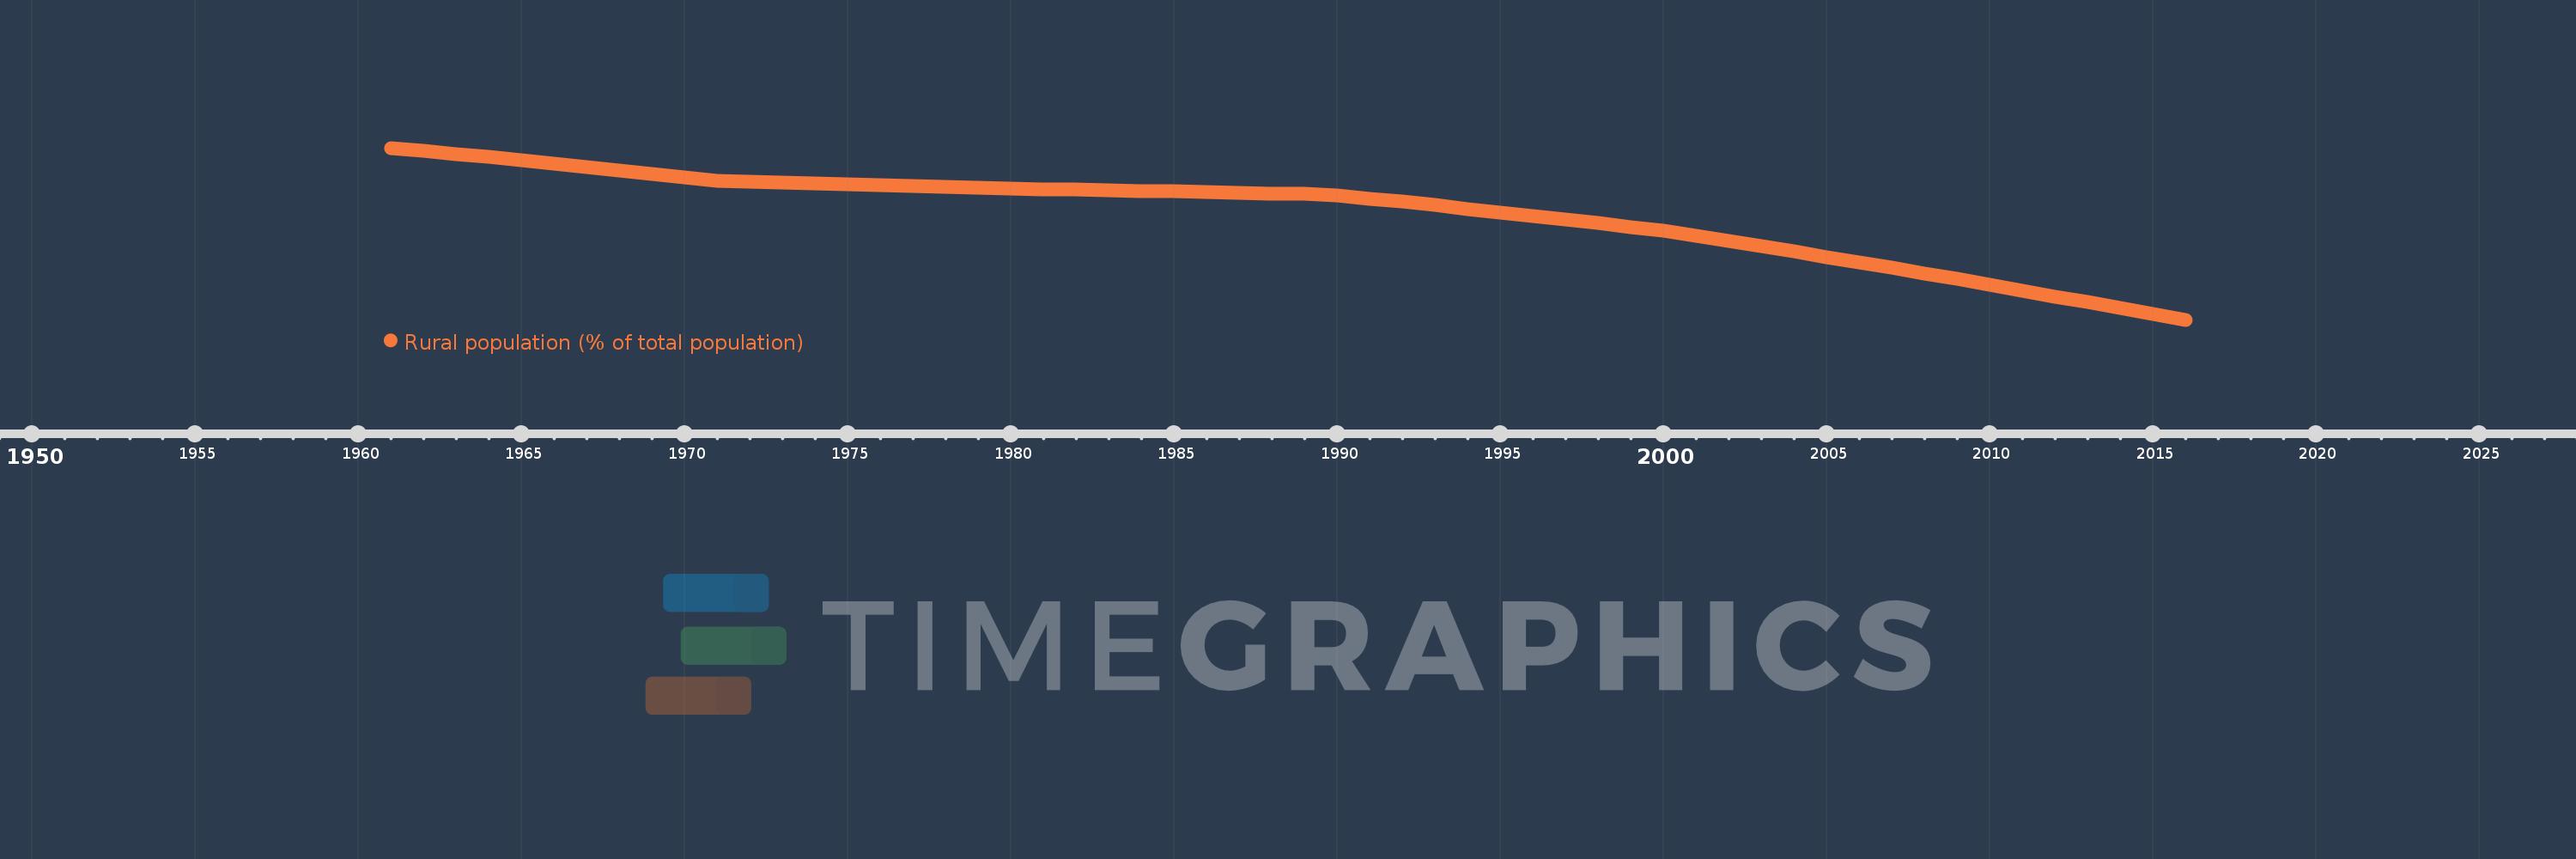
Rural population (% of total population)
2016,2015,2014,2013,2012,2011,2010,2009,2008,2007,2006,2005,2004,2003,2002,2001,2000,1999,1998,1997,1996,1995,1994,1993,1992,1991,1990,1989,1988,1987,1986,1985,1984,1983,1982,1981,1980,1979,1978,1977,1976,1975,1974,1973,1972,1971,1970,1969,1968,1967,1966,1965,1964,1963,1962,1961
This statistics in other country:
AfghanistanAlbaniaAlgeriaAmerican SamoaAndorraAngolaAntigua and BarbudaArab WorldArgentinaArmeniaArubaAustraliaAustriaAzerbaijanBahamas, TheBahrainBangladeshBarbadosBelarusBelgiumBelizeBeninBermudaBhutanBoliviaBosnia and HerzegovinaBotswanaBrazilBritish Virgin IslandsBrunei DarussalamBulgariaBurkina FasoBurundiCabo VerdeCambodiaCameroonCanadaCaribbean small statesCayman IslandsCentral African RepublicCentral Europe and the BalticsChadChannel IslandsChileChinaColombiaComorosCongo, Dem. Rep.Congo, Rep.Costa RicaCote d'IvoireCroatiaCubaCuracaoCyprusCzech RepublicDenmarkDjiboutiDominicaDominican RepublicEarly-demographic dividendEast Asia & PacificEast Asia & Pacific (excluding high income)East Asia & Pacific (IDA & IBRD countries)EcuadorEgypt, Arab Rep.El SalvadorEquatorial GuineaEritreaEstoniaEthiopiaEuro areaEurope & Central AsiaEurope & Central Asia (excluding high income)Europe & Central Asia (IDA & IBRD countries)European UnionFaroe IslandsFijiFinlandFragile and conflict affected situationsFranceFrench PolynesiaGabonGambia, TheGeorgiaGermanyGhanaGibraltarGreeceGreenlandGrenadaGuamGuatemalaGuineaGuinea-BissauGuyanaHaitiHeavily indebted poor countries (HIPC)High incomeHondurasHong Kong SAR, ChinaHungaryIBRD onlyIcelandIDA & IBRD totalIDA blendIDA onlyIDA totalIndiaIndonesiaIran, Islamic Rep.IraqIrelandIsle of ManIsraelItalyJamaicaJapanJordanKazakhstanKenyaKiribatiKorea, Dem. People’s Rep.Korea, Rep.KuwaitKyrgyz RepublicLao PDRLate-demographic dividendLatin America & Caribbean Latin America & Caribbean (excluding high income)Latin America & the Caribbean (IDA & IBRD countries)LatviaLeast developed countries: UN classificationLebanonLesothoLiberiaLibyaLiechtensteinLithuaniaLow & middle incomeLow incomeLower middle incomeLuxembourgMacao SAR, ChinaMacedonia, FYRMadagascarMalawiMalaysiaMaldivesMaliMaltaMarshall IslandsMauritaniaMauritiusMexicoMicronesia, Fed. Sts.Middle East & North AfricaMiddle East & North Africa (excluding high income)Middle East & North Africa (IDA & IBRD countries)Middle incomeMoldovaMonacoMongoliaMontenegroMoroccoMozambiqueMyanmarNamibiaNauruNepalNetherlandsNew CaledoniaNew ZealandNicaraguaNigerNigeriaNorth AmericaNorthern Mariana IslandsNorwayOECD membersOmanOther small statesPacific island small statesPakistanPalauPanamaPapua New GuineaParaguayPeruPhilippinesPolandPortugalPost-demographic dividendPre-demographic dividendPuerto RicoQatarRomaniaRussian FederationRwandaSamoaSan MarinoSao Tome and PrincipeSaudi ArabiaSenegalSerbiaSeychellesSierra LeoneSingaporeSint Maarten (Dutch part)Slovak RepublicSloveniaSmall statesSolomon IslandsSomaliaSouth AfricaSouth AsiaSouth Asia (IDA & IBRD)South SudanSpainSri LankaSt. Kitts and NevisSt. LuciaSt. Vincent and the GrenadinesSub-Saharan Africa Sub-Saharan Africa (excluding high income)Sub-Saharan Africa (IDA & IBRD countries)SudanSurinameSwazilandSwedenSwitzerlandSyrian Arab RepublicTajikistanTanzaniaThailandTimor-LesteTogoTongaTrinidad and TobagoTunisiaTurkeyTurkmenistanTurks and Caicos IslandsTuvaluUgandaUkraineUnited Arab EmiratesUnited KingdomUnited StatesUpper middle incomeUruguayUzbekistanVanuatuVenezuela, RBVietnamVirgin Islands (U.S.)West Bank and GazaWorldYemen, Rep.ZambiaZimbabwe Timeline:
This timeline shows a graph from 1961 to 2016 of Vietnam. No data until 1960. Number of actual observations by date: 56.
Source name:
World Development Indicators
Source organization:
World Bank Staff estimates based on United Nations, World Urbanization Prospects.
Categories, topics:
Agriculture & Rural Development
Last updated:
apr 23, 2017
Indicators value changes by year
Minimum:
66.407
jan 1, 2016
At the date of observation
Value
Absolute change
Change from previous value
jan 1, 1961
85.3
+85.3
0.0%
jan 1, 1962
84.969
-0.331
-0.39%
jan 1, 1963
84.631
-0.338
-0.4%
jan 1, 1964
84.286
-0.345
-0.41%
jan 1, 1965
83.936
-0.35
-0.42%
jan 1, 1966
83.579
-0.357
-0.43%
jan 1, 1967
83.216
-0.363
-0.43%
jan 1, 1968
82.847
-0.369
-0.44%
jan 1, 1969
82.471
-0.376
-0.45%
jan 1, 1970
82.089
-0.382
-0.46%
jan 1, 1971
81.7
-0.389
-0.47%
jan 1, 1972
81.604
-0.096
-0.12%
jan 1, 1973
81.508
-0.096
-0.12%
jan 1, 1974
81.412
-0.096
-0.12%
jan 1, 1975
81.315
-0.097
-0.12%
jan 1, 1976
81.218
-0.097
-0.12%
jan 1, 1977
81.12
-0.098
-0.12%
jan 1, 1978
81.022
-0.098
-0.12%
jan 1, 1979
80.924
-0.098
-0.12%
jan 1, 1980
80.825
-0.099
-0.12%
jan 1, 1981
80.753
-0.072
-0.09%
jan 1, 1982
80.691
-0.062
-0.08%
jan 1, 1983
80.628
-0.063
-0.08%
jan 1, 1984
80.565
-0.063
-0.08%
jan 1, 1985
80.502
-0.063
-0.08%
jan 1, 1986
80.439
-0.063
-0.08%
jan 1, 1987
80.375
-0.064
-0.08%
jan 1, 1988
80.312
-0.063
-0.08%
jan 1, 1989
80.248
-0.064
-0.08%
jan 1, 1990
80.11
-0.138
-0.17%
jan 1, 1991
79.745
-0.365
-0.46%
jan 1, 1992
79.375
-0.37
-0.46%
jan 1, 1993
79.0
-0.375
-0.47%
jan 1, 1994
78.603
-0.397
-0.5%
jan 1, 1995
78.2
-0.403
-0.51%
jan 1, 1996
77.813
-0.387
-0.49%
jan 1, 1997
77.421
-0.392
-0.5%
jan 1, 1998
77.026
-0.395
-0.51%
jan 1, 1999
76.624
-0.402
-0.52%
jan 1, 2000
76.183
-0.441
-0.58%
jan 1, 2001
75.626
-0.557
-0.73%
jan 1, 2002
75.063
-0.563
-0.74%
jan 1, 2003
74.489
-0.574
-0.76%
jan 1, 2004
73.908
-0.581
-0.78%
jan 1, 2005
73.317
-0.591
-0.8%
jan 1, 2006
72.719
-0.598
-0.82%
jan 1, 2007
72.112
-0.607
-0.83%
jan 1, 2008
71.496
-0.616
-0.85%
jan 1, 2009
70.872
-0.624
-0.87%
jan 1, 2010
70.242
-0.63
-0.89%
jan 1, 2011
69.608
-0.634
-0.9%
jan 1, 2012
68.971
-0.637
-0.92%
jan 1, 2013
68.332
-0.639
-0.93%
jan 1, 2014
67.691
-0.641
-0.94%
jan 1, 2015
67.049
-0.642
-0.95%
jan 1, 2016
66.407
-0.642
-0.96%
Ranking of countries by current statistics by years


Comments: