29
/
en
AIzaSyAYiBZKx7MnpbEhh9jyipgxe19OcubqV5w
April 1, 2024
86551
Bhutan
BTN
true
2
1
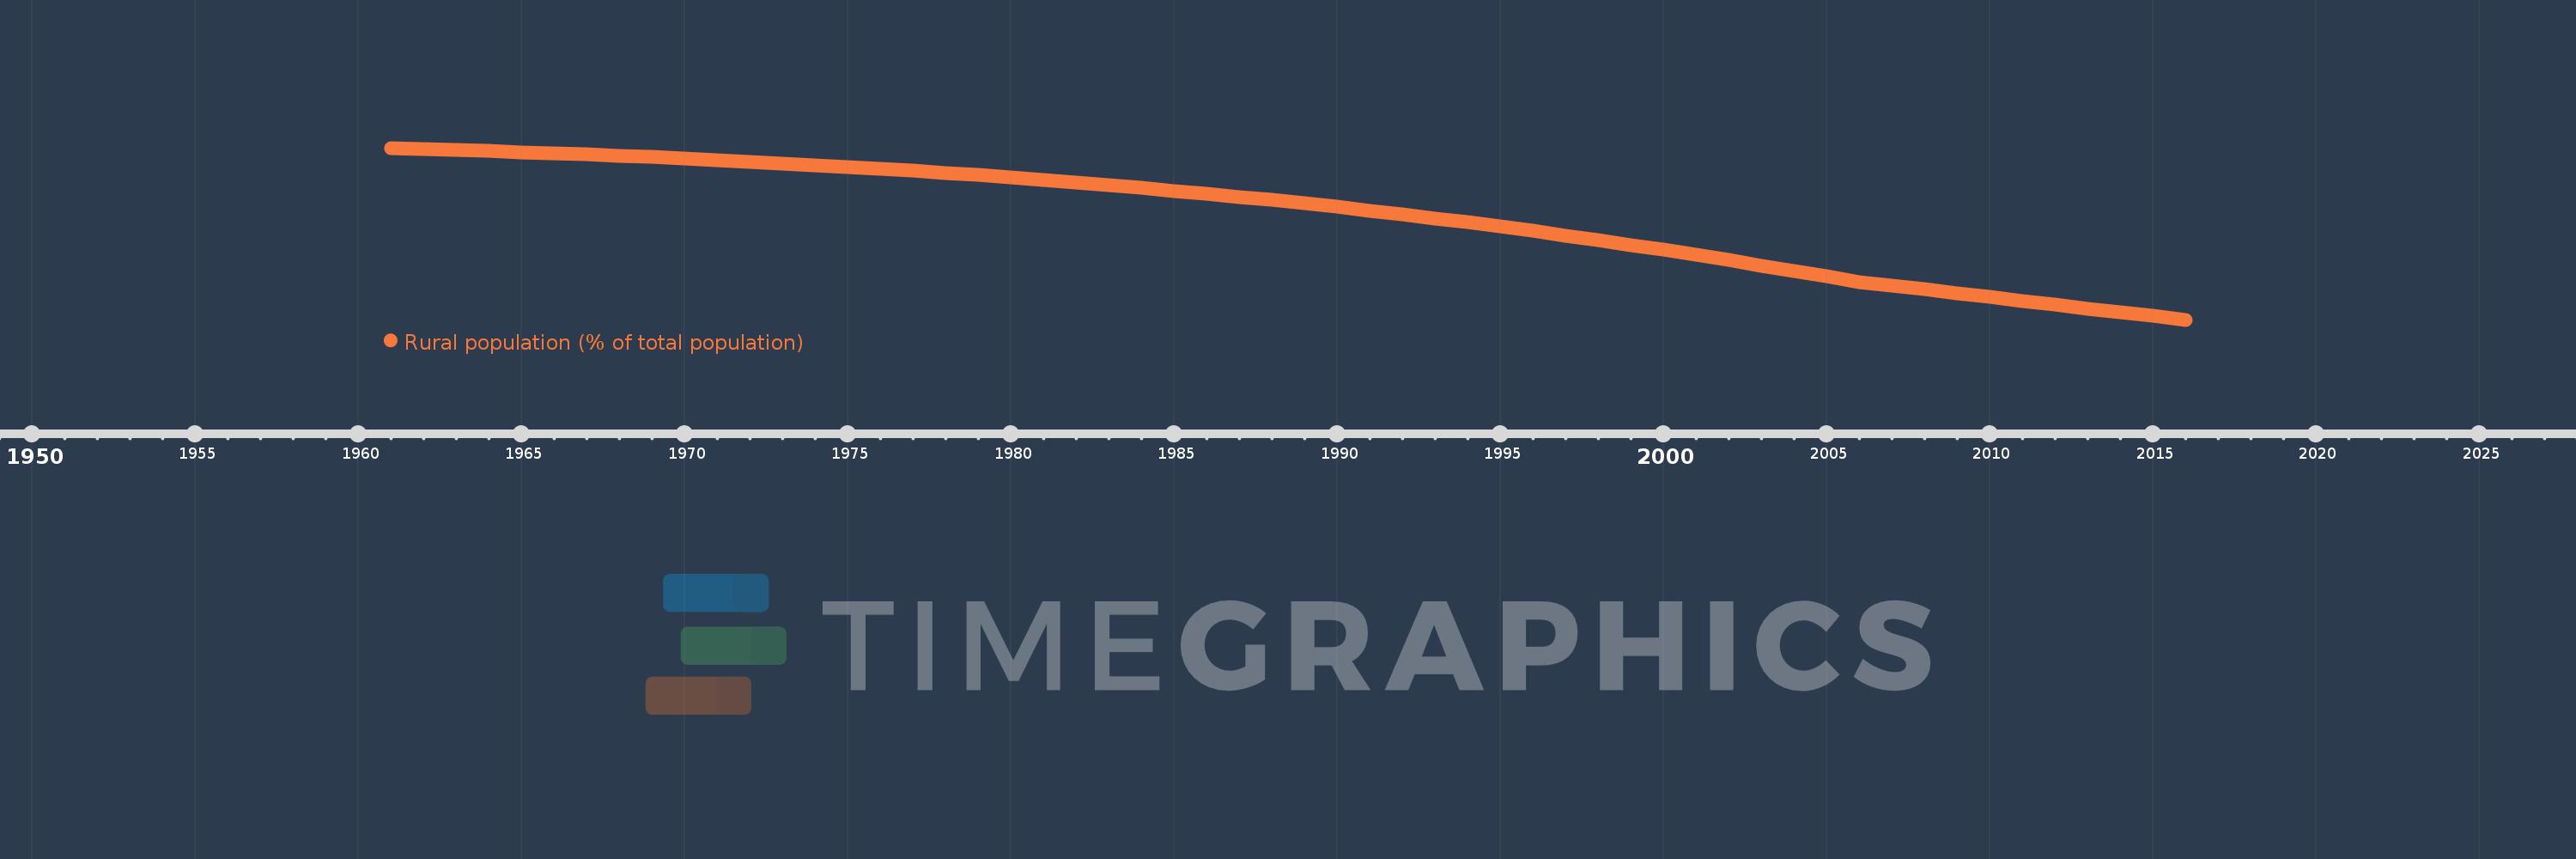
Rural population (% of total population)
2016,2015,2014,2013,2012,2011,2010,2009,2008,2007,2006,2005,2004,2003,2002,2001,2000,1999,1998,1997,1996,1995,1994,1993,1992,1991,1990,1989,1988,1987,1986,1985,1984,1983,1982,1981,1980,1979,1978,1977,1976,1975,1974,1973,1972,1971,1970,1969,1968,1967,1966,1965,1964,1963,1962,1961
This statistics in other country:
AfghanistanAlbaniaAlgeriaAmerican SamoaAndorraAngolaAntigua and BarbudaArab WorldArgentinaArmeniaArubaAustraliaAustriaAzerbaijanBahamas, TheBahrainBangladeshBarbadosBelarusBelgiumBelizeBeninBermudaBhutanBoliviaBosnia and HerzegovinaBotswanaBrazilBritish Virgin IslandsBrunei DarussalamBulgariaBurkina FasoBurundiCabo VerdeCambodiaCameroonCanadaCaribbean small statesCayman IslandsCentral African RepublicCentral Europe and the BalticsChadChannel IslandsChileChinaColombiaComorosCongo, Dem. Rep.Congo, Rep.Costa RicaCote d'IvoireCroatiaCubaCuracaoCyprusCzech RepublicDenmarkDjiboutiDominicaDominican RepublicEarly-demographic dividendEast Asia & PacificEast Asia & Pacific (excluding high income)East Asia & Pacific (IDA & IBRD countries)EcuadorEgypt, Arab Rep.El SalvadorEquatorial GuineaEritreaEstoniaEthiopiaEuro areaEurope & Central AsiaEurope & Central Asia (excluding high income)Europe & Central Asia (IDA & IBRD countries)European UnionFaroe IslandsFijiFinlandFragile and conflict affected situationsFranceFrench PolynesiaGabonGambia, TheGeorgiaGermanyGhanaGibraltarGreeceGreenlandGrenadaGuamGuatemalaGuineaGuinea-BissauGuyanaHaitiHeavily indebted poor countries (HIPC)High incomeHondurasHong Kong SAR, ChinaHungaryIBRD onlyIcelandIDA & IBRD totalIDA blendIDA onlyIDA totalIndiaIndonesiaIran, Islamic Rep.IraqIrelandIsle of ManIsraelItalyJamaicaJapanJordanKazakhstanKenyaKiribatiKorea, Dem. People’s Rep.Korea, Rep.KuwaitKyrgyz RepublicLao PDRLate-demographic dividendLatin America & Caribbean Latin America & Caribbean (excluding high income)Latin America & the Caribbean (IDA & IBRD countries)LatviaLeast developed countries: UN classificationLebanonLesothoLiberiaLibyaLiechtensteinLithuaniaLow & middle incomeLow incomeLower middle incomeLuxembourgMacao SAR, ChinaMacedonia, FYRMadagascarMalawiMalaysiaMaldivesMaliMaltaMarshall IslandsMauritaniaMauritiusMexicoMicronesia, Fed. Sts.Middle East & North AfricaMiddle East & North Africa (excluding high income)Middle East & North Africa (IDA & IBRD countries)Middle incomeMoldovaMonacoMongoliaMontenegroMoroccoMozambiqueMyanmarNamibiaNauruNepalNetherlandsNew CaledoniaNew ZealandNicaraguaNigerNigeriaNorth AmericaNorthern Mariana IslandsNorwayOECD membersOmanOther small statesPacific island small statesPakistanPalauPanamaPapua New GuineaParaguayPeruPhilippinesPolandPortugalPost-demographic dividendPre-demographic dividendPuerto RicoQatarRomaniaRussian FederationRwandaSamoaSan MarinoSao Tome and PrincipeSaudi ArabiaSenegalSerbiaSeychellesSierra LeoneSingaporeSint Maarten (Dutch part)Slovak RepublicSloveniaSmall statesSolomon IslandsSomaliaSouth AfricaSouth AsiaSouth Asia (IDA & IBRD)South SudanSpainSri LankaSt. Kitts and NevisSt. LuciaSt. Vincent and the GrenadinesSub-Saharan Africa Sub-Saharan Africa (excluding high income)Sub-Saharan Africa (IDA & IBRD countries)SudanSurinameSwazilandSwedenSwitzerlandSyrian Arab RepublicTajikistanTanzaniaThailandTimor-LesteTogoTongaTrinidad and TobagoTunisiaTurkeyTurkmenistanTurks and Caicos IslandsTuvaluUgandaUkraineUnited Arab EmiratesUnited KingdomUnited StatesUpper middle incomeUruguayUzbekistanVanuatuVenezuela, RBVietnamVirgin Islands (U.S.)West Bank and GazaWorldYemen, Rep.ZambiaZimbabwe Timeline:
This timeline shows a graph from 1961 to 2016 of Bhutan. No data until 1960. Number of actual observations by date: 56.
Source name:
World Development Indicators
Source organization:
World Bank Staff estimates based on United Nations, World Urbanization Prospects.
Categories, topics:
Agriculture & Rural Development
Last updated:
apr 23, 2017
Indicators value changes by year
Minimum:
61.356
jan 1, 2016
Maximum:
96.404
jan 1, 1961
At the date of observation
Value
Absolute change
Change from previous value
jan 1, 1961
96.404
+96.404
0.0%
jan 1, 1962
96.208
-0.196
-0.2%
jan 1, 1963
96.001
-0.207
-0.22%
jan 1, 1964
95.783
-0.218
-0.23%
jan 1, 1965
95.554
-0.229
-0.24%
jan 1, 1966
95.313
-0.241
-0.25%
jan 1, 1967
95.06
-0.253
-0.27%
jan 1, 1968
94.793
-0.267
-0.28%
jan 1, 1969
94.513
-0.28
-0.3%
jan 1, 1970
94.219
-0.294
-0.31%
jan 1, 1971
93.911
-0.308
-0.33%
jan 1, 1972
93.587
-0.324
-0.35%
jan 1, 1973
93.246
-0.341
-0.36%
jan 1, 1974
92.89
-0.356
-0.38%
jan 1, 1975
92.516
-0.374
-0.4%
jan 1, 1976
92.124
-0.392
-0.42%
jan 1, 1977
91.712
-0.412
-0.45%
jan 1, 1978
91.283
-0.429
-0.47%
jan 1, 1979
90.832
-0.451
-0.49%
jan 1, 1980
90.361
-0.471
-0.52%
jan 1, 1981
89.868
-0.493
-0.55%
jan 1, 1982
89.354
-0.514
-0.57%
jan 1, 1983
88.816
-0.538
-0.6%
jan 1, 1984
88.255
-0.561
-0.63%
jan 1, 1985
87.668
-0.587
-0.67%
jan 1, 1986
87.059
-0.609
-0.69%
jan 1, 1987
86.423
-0.636
-0.73%
jan 1, 1988
85.76
-0.663
-0.77%
jan 1, 1989
85.071
-0.689
-0.8%
jan 1, 1990
84.355
-0.716
-0.84%
jan 1, 1991
83.612
-0.743
-0.88%
jan 1, 1992
82.839
-0.773
-0.92%
jan 1, 1993
82.038
-0.801
-0.97%
jan 1, 1994
81.209
-0.829
-1.01%
jan 1, 1995
80.351
-0.858
-1.06%
jan 1, 1996
79.463
-0.888
-1.11%
jan 1, 1997
78.544
-0.919
-1.16%
jan 1, 1998
77.599
-0.945
-1.2%
jan 1, 1999
76.623
-0.976
-1.26%
jan 1, 2000
75.617
-1.006
-1.31%
jan 1, 2001
74.582
-1.035
-1.37%
jan 1, 2002
73.52
-1.062
-1.42%
jan 1, 2003
72.43
-1.09
-1.48%
jan 1, 2004
71.312
-1.118
-1.54%
jan 1, 2005
70.165
-1.147
-1.61%
jan 1, 2006
69.035
-1.13
-1.61%
jan 1, 2007
68.288
-0.747
-1.08%
jan 1, 2008
67.531
-0.757
-1.11%
jan 1, 2009
66.764
-0.767
-1.14%
jan 1, 2010
65.99
-0.774
-1.16%
jan 1, 2011
65.207
-0.783
-1.19%
jan 1, 2012
64.415
-0.792
-1.21%
jan 1, 2013
63.632
-0.783
-1.22%
jan 1, 2014
62.861
-0.771
-1.21%
jan 1, 2015
62.102
-0.759
-1.21%
jan 1, 2016
61.356
-0.746
-1.2%
Ranking of countries by current statistics by years


Comments: