29
/
en
AIzaSyAYiBZKx7MnpbEhh9jyipgxe19OcubqV5w
April 1, 2024
253649
Sudan
SDN
true
2
1
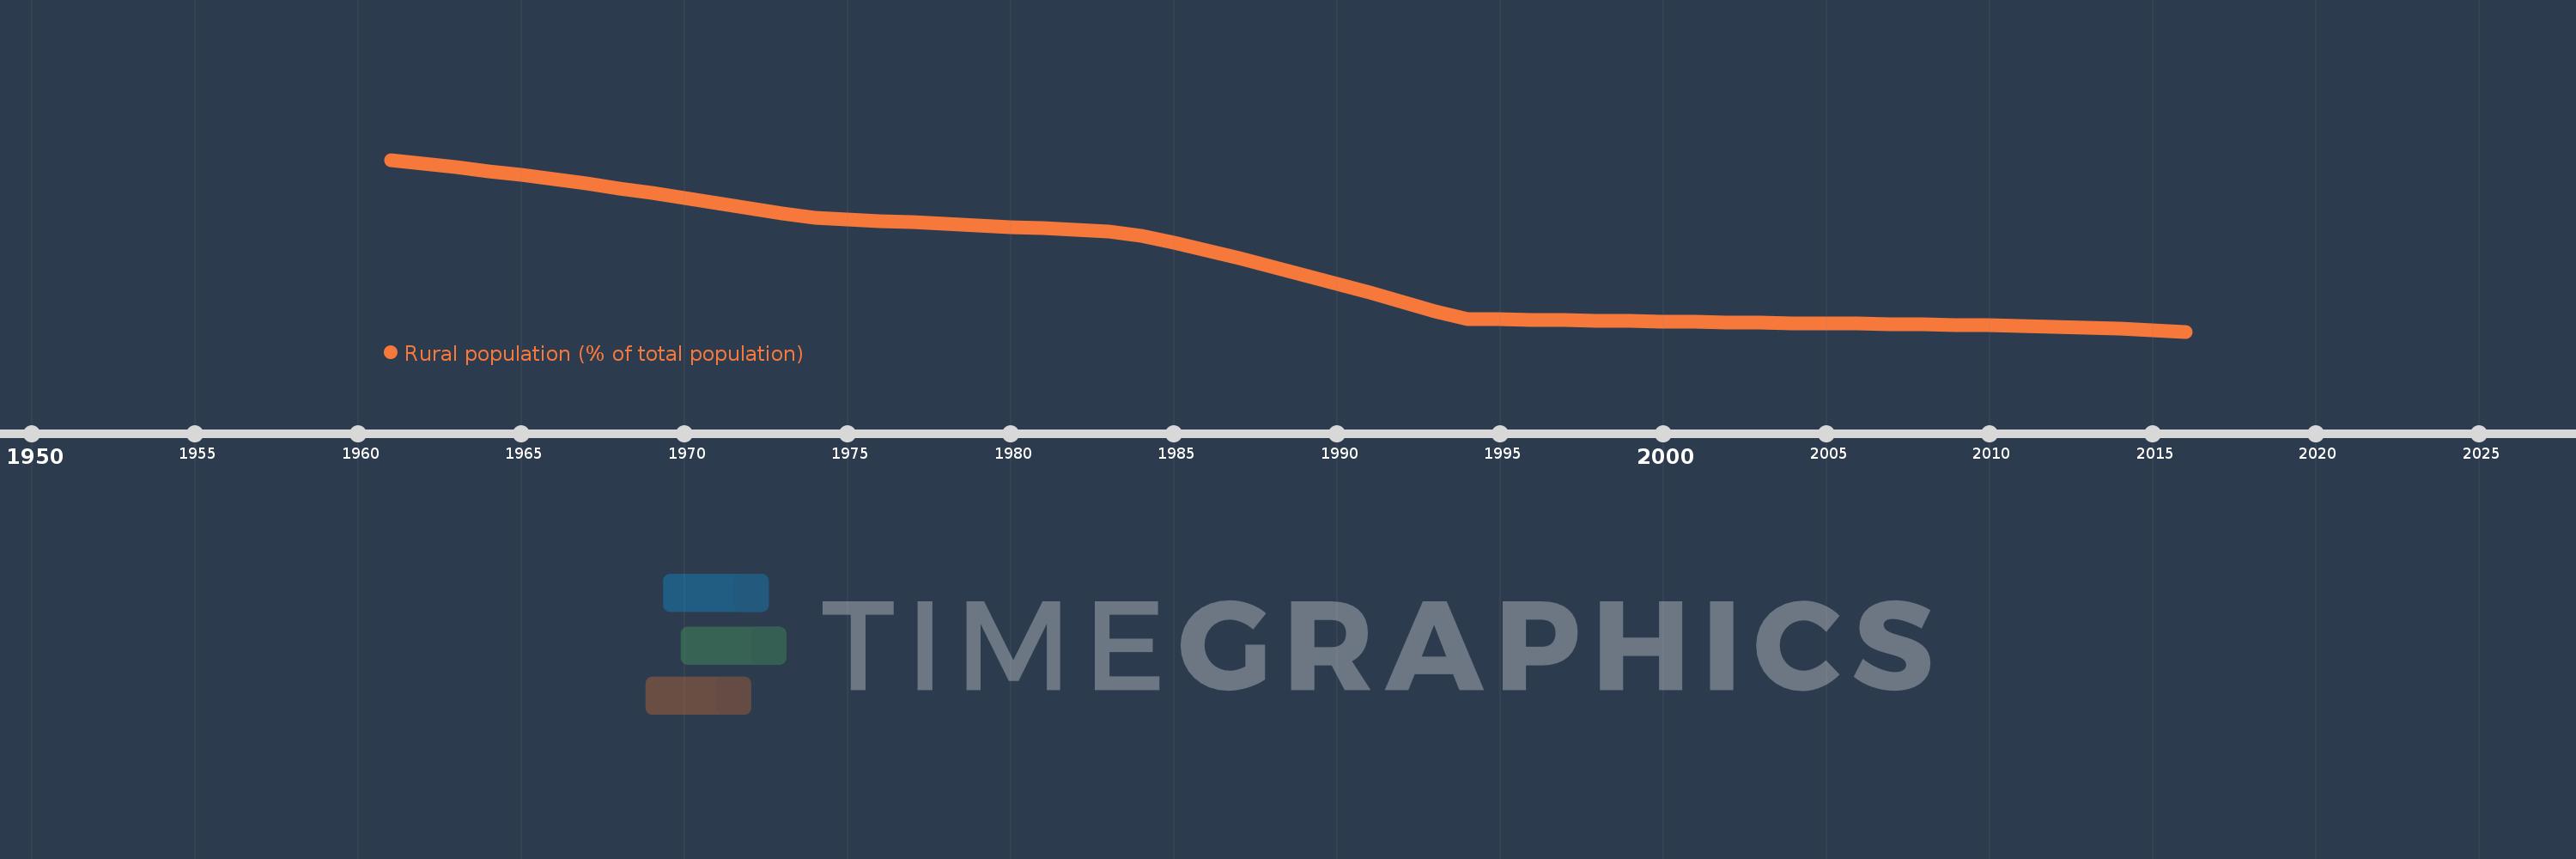
Rural population (% of total population)
2016,2015,2014,2013,2012,2011,2010,2009,2008,2007,2006,2005,2004,2003,2002,2001,2000,1999,1998,1997,1996,1995,1994,1993,1992,1991,1990,1989,1988,1987,1986,1985,1984,1983,1982,1981,1980,1979,1978,1977,1976,1975,1974,1973,1972,1971,1970,1969,1968,1967,1966,1965,1964,1963,1962,1961
This statistics in other country:
AfghanistanAlbaniaAlgeriaAmerican SamoaAndorraAngolaAntigua and BarbudaArab WorldArgentinaArmeniaArubaAustraliaAustriaAzerbaijanBahamas, TheBahrainBangladeshBarbadosBelarusBelgiumBelizeBeninBermudaBhutanBoliviaBosnia and HerzegovinaBotswanaBrazilBritish Virgin IslandsBrunei DarussalamBulgariaBurkina FasoBurundiCabo VerdeCambodiaCameroonCanadaCaribbean small statesCayman IslandsCentral African RepublicCentral Europe and the BalticsChadChannel IslandsChileChinaColombiaComorosCongo, Dem. Rep.Congo, Rep.Costa RicaCote d'IvoireCroatiaCubaCuracaoCyprusCzech RepublicDenmarkDjiboutiDominicaDominican RepublicEarly-demographic dividendEast Asia & PacificEast Asia & Pacific (excluding high income)East Asia & Pacific (IDA & IBRD countries)EcuadorEgypt, Arab Rep.El SalvadorEquatorial GuineaEritreaEstoniaEthiopiaEuro areaEurope & Central AsiaEurope & Central Asia (excluding high income)Europe & Central Asia (IDA & IBRD countries)European UnionFaroe IslandsFijiFinlandFragile and conflict affected situationsFranceFrench PolynesiaGabonGambia, TheGeorgiaGermanyGhanaGibraltarGreeceGreenlandGrenadaGuamGuatemalaGuineaGuinea-BissauGuyanaHaitiHeavily indebted poor countries (HIPC)High incomeHondurasHong Kong SAR, ChinaHungaryIBRD onlyIcelandIDA & IBRD totalIDA blendIDA onlyIDA totalIndiaIndonesiaIran, Islamic Rep.IraqIrelandIsle of ManIsraelItalyJamaicaJapanJordanKazakhstanKenyaKiribatiKorea, Dem. People’s Rep.Korea, Rep.KuwaitKyrgyz RepublicLao PDRLate-demographic dividendLatin America & Caribbean Latin America & Caribbean (excluding high income)Latin America & the Caribbean (IDA & IBRD countries)LatviaLeast developed countries: UN classificationLebanonLesothoLiberiaLibyaLiechtensteinLithuaniaLow & middle incomeLow incomeLower middle incomeLuxembourgMacao SAR, ChinaMacedonia, FYRMadagascarMalawiMalaysiaMaldivesMaliMaltaMarshall IslandsMauritaniaMauritiusMexicoMicronesia, Fed. Sts.Middle East & North AfricaMiddle East & North Africa (excluding high income)Middle East & North Africa (IDA & IBRD countries)Middle incomeMoldovaMonacoMongoliaMontenegroMoroccoMozambiqueMyanmarNamibiaNauruNepalNetherlandsNew CaledoniaNew ZealandNicaraguaNigerNigeriaNorth AmericaNorthern Mariana IslandsNorwayOECD membersOmanOther small statesPacific island small statesPakistanPalauPanamaPapua New GuineaParaguayPeruPhilippinesPolandPortugalPost-demographic dividendPre-demographic dividendPuerto RicoQatarRomaniaRussian FederationRwandaSamoaSan MarinoSao Tome and PrincipeSaudi ArabiaSenegalSerbiaSeychellesSierra LeoneSingaporeSint Maarten (Dutch part)Slovak RepublicSloveniaSmall statesSolomon IslandsSomaliaSouth AfricaSouth AsiaSouth Asia (IDA & IBRD)South SudanSpainSri LankaSt. Kitts and NevisSt. LuciaSt. Vincent and the GrenadinesSub-Saharan Africa Sub-Saharan Africa (excluding high income)Sub-Saharan Africa (IDA & IBRD countries)SudanSurinameSwazilandSwedenSwitzerlandSyrian Arab RepublicTajikistanTanzaniaThailandTimor-LesteTogoTongaTrinidad and TobagoTunisiaTurkeyTurkmenistanTurks and Caicos IslandsTuvaluUgandaUkraineUnited Arab EmiratesUnited KingdomUnited StatesUpper middle incomeUruguayUzbekistanVanuatuVenezuela, RBVietnamVirgin Islands (U.S.)West Bank and GazaWorldYemen, Rep.ZambiaZimbabwe Timeline:
This timeline shows a graph from 1961 to 2016 of Sudan. No data until 1960. Number of actual observations by date: 56.
Source name:
World Development Indicators
Source organization:
World Bank Staff estimates based on United Nations, World Urbanization Prospects.
Categories, topics:
Agriculture & Rural Development
Last updated:
apr 23, 2017
Indicators value changes by year
Minimum:
66.194
jan 1, 2016
Maximum:
89.254
jan 1, 1961
At the date of observation
Value
Absolute change
Change from previous value
jan 1, 1961
89.254
+89.254
0.0%
jan 1, 1962
88.768
-0.486
-0.54%
jan 1, 1963
88.263
-0.505
-0.57%
jan 1, 1964
87.738
-0.525
-0.59%
jan 1, 1965
87.192
-0.546
-0.62%
jan 1, 1966
86.627
-0.565
-0.65%
jan 1, 1967
86.041
-0.586
-0.68%
jan 1, 1968
85.433
-0.608
-0.71%
jan 1, 1969
84.803
-0.63
-0.74%
jan 1, 1970
84.152
-0.651
-0.77%
jan 1, 1971
83.477
-0.675
-0.8%
jan 1, 1972
82.78
-0.697
-0.83%
jan 1, 1973
82.059
-0.721
-0.87%
jan 1, 1974
81.452
-0.607
-0.74%
jan 1, 1975
81.256
-0.196
-0.24%
jan 1, 1976
81.057
-0.199
-0.24%
jan 1, 1977
80.857
-0.2
-0.25%
jan 1, 1978
80.656
-0.201
-0.25%
jan 1, 1979
80.453
-0.203
-0.25%
jan 1, 1980
80.248
-0.205
-0.25%
jan 1, 1981
80.041
-0.207
-0.26%
jan 1, 1982
79.834
-0.207
-0.26%
jan 1, 1983
79.624
-0.21
-0.26%
jan 1, 1984
79.099
-0.525
-0.66%
jan 1, 1985
78.097
-1.002
-1.27%
jan 1, 1986
77.063
-1.034
-1.32%
jan 1, 1987
75.995
-1.068
-1.39%
jan 1, 1988
74.893
-1.102
-1.45%
jan 1, 1989
73.756
-1.137
-1.52%
jan 1, 1990
72.59
-1.166
-1.58%
jan 1, 1991
71.39
-1.2
-1.65%
jan 1, 1992
70.16
-1.23
-1.72%
jan 1, 1993
68.897
-1.263
-1.8%
jan 1, 1994
67.873
-1.024
-1.49%
jan 1, 1995
67.821
-0.052
-0.08%
jan 1, 1996
67.768
-0.053
-0.08%
jan 1, 1997
67.716
-0.052
-0.08%
jan 1, 1998
67.663
-0.053
-0.08%
jan 1, 1999
67.61
-0.053
-0.08%
jan 1, 2000
67.558
-0.052
-0.08%
jan 1, 2001
67.505
-0.053
-0.08%
jan 1, 2002
67.452
-0.053
-0.08%
jan 1, 2003
67.399
-0.053
-0.08%
jan 1, 2004
67.346
-0.053
-0.08%
jan 1, 2005
67.293
-0.053
-0.08%
jan 1, 2006
67.24
-0.053
-0.08%
jan 1, 2007
67.187
-0.053
-0.08%
jan 1, 2008
67.134
-0.053
-0.08%
jan 1, 2009
67.081
-0.053
-0.08%
jan 1, 2010
67.01
-0.071
-0.11%
jan 1, 2011
66.92
-0.09
-0.13%
jan 1, 2012
66.812
-0.108
-0.16%
jan 1, 2013
66.685
-0.127
-0.19%
jan 1, 2014
66.54
-0.145
-0.22%
jan 1, 2015
66.377
-0.163
-0.24%
jan 1, 2016
66.194
-0.183
-0.28%
Ranking of countries by current statistics by years


Comments: