29
/
en
AIzaSyAYiBZKx7MnpbEhh9jyipgxe19OcubqV5w
April 1, 2024
104466
Channel Islands
CHI
true
2
1
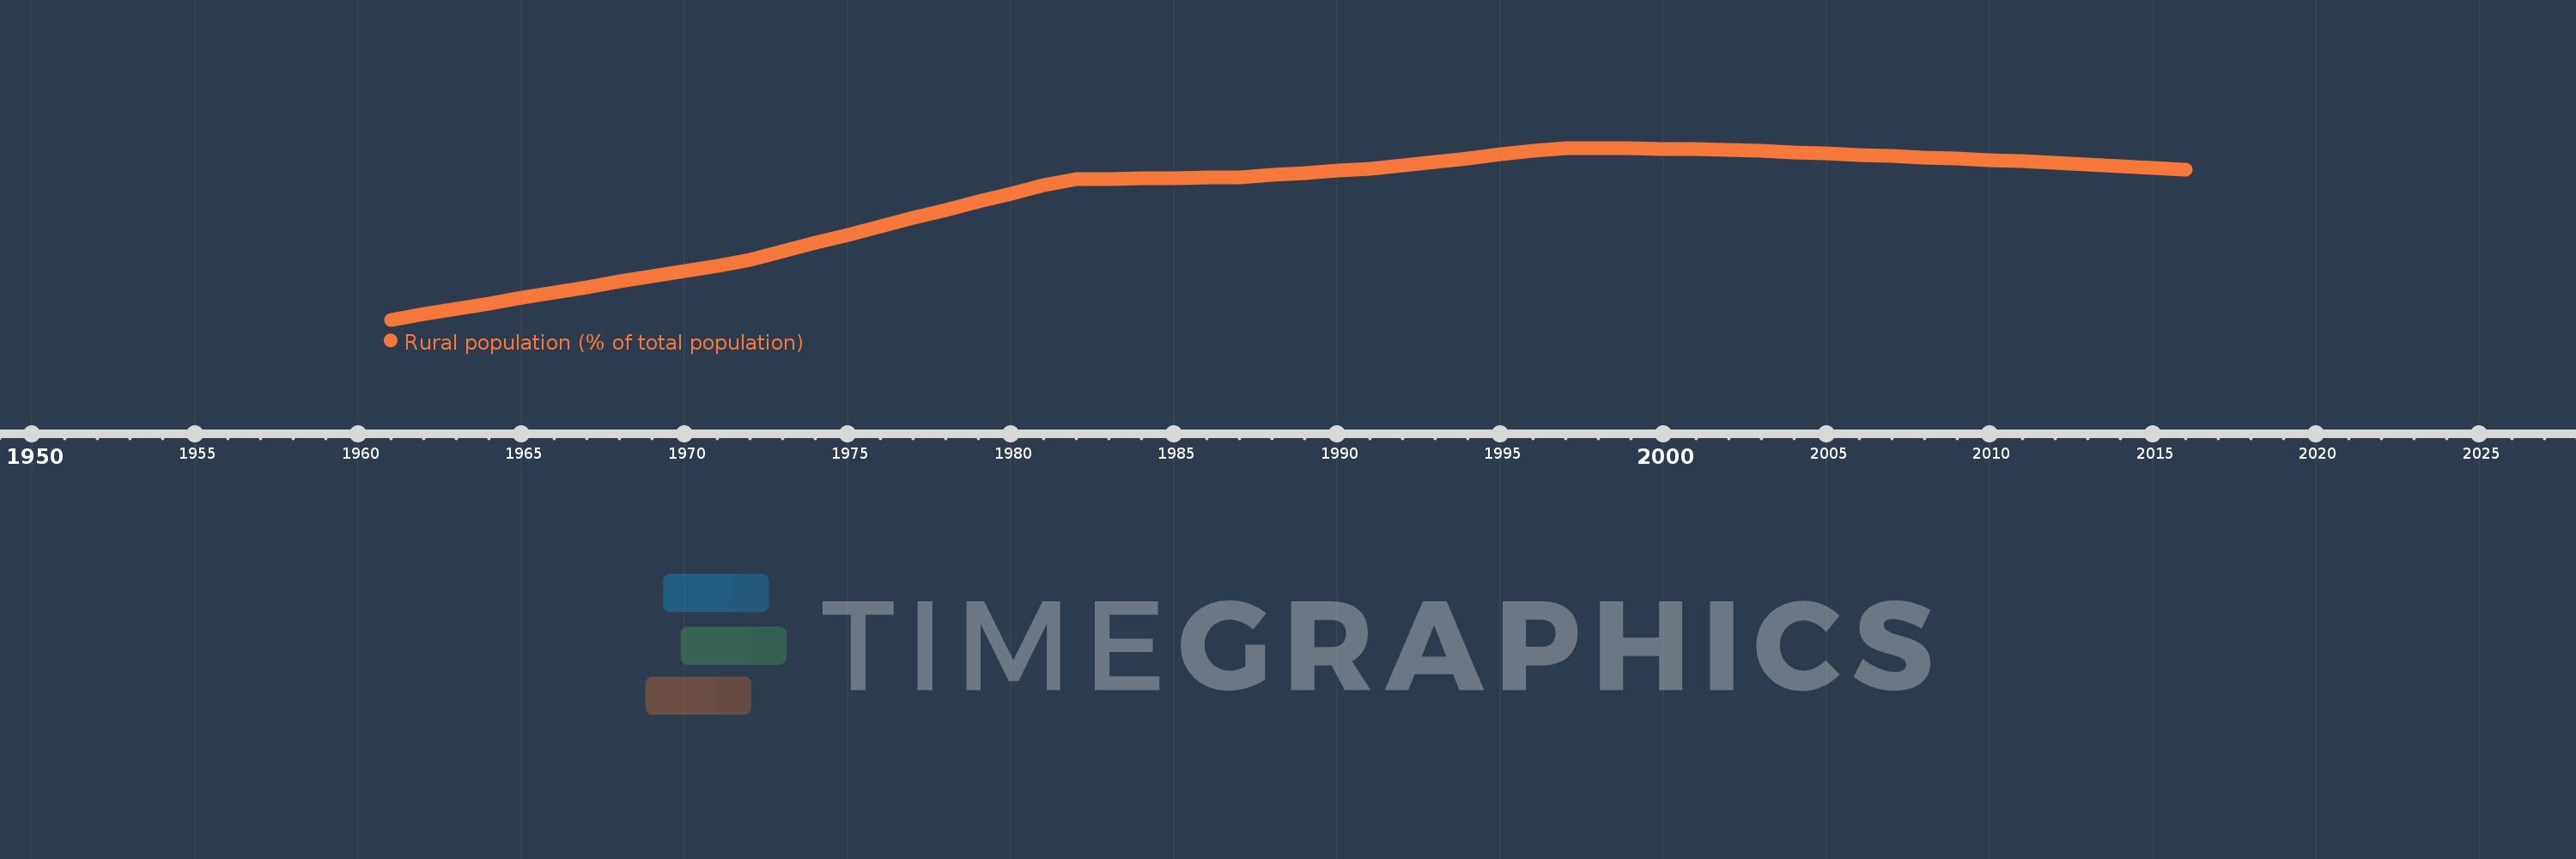
Rural population (% of total population)
2016,2015,2014,2013,2012,2011,2010,2009,2008,2007,2006,2005,2004,2003,2002,2001,2000,1999,1998,1997,1996,1995,1994,1993,1992,1991,1990,1989,1988,1987,1986,1985,1984,1983,1982,1981,1980,1979,1978,1977,1976,1975,1974,1973,1972,1971,1970,1969,1968,1967,1966,1965,1964,1963,1962,1961
This statistics in other country:
AfghanistanAlbaniaAlgeriaAmerican SamoaAndorraAngolaAntigua and BarbudaArab WorldArgentinaArmeniaArubaAustraliaAustriaAzerbaijanBahamas, TheBahrainBangladeshBarbadosBelarusBelgiumBelizeBeninBermudaBhutanBoliviaBosnia and HerzegovinaBotswanaBrazilBritish Virgin IslandsBrunei DarussalamBulgariaBurkina FasoBurundiCabo VerdeCambodiaCameroonCanadaCaribbean small statesCayman IslandsCentral African RepublicCentral Europe and the BalticsChadChannel IslandsChileChinaColombiaComorosCongo, Dem. Rep.Congo, Rep.Costa RicaCote d'IvoireCroatiaCubaCuracaoCyprusCzech RepublicDenmarkDjiboutiDominicaDominican RepublicEarly-demographic dividendEast Asia & PacificEast Asia & Pacific (excluding high income)East Asia & Pacific (IDA & IBRD countries)EcuadorEgypt, Arab Rep.El SalvadorEquatorial GuineaEritreaEstoniaEthiopiaEuro areaEurope & Central AsiaEurope & Central Asia (excluding high income)Europe & Central Asia (IDA & IBRD countries)European UnionFaroe IslandsFijiFinlandFragile and conflict affected situationsFranceFrench PolynesiaGabonGambia, TheGeorgiaGermanyGhanaGibraltarGreeceGreenlandGrenadaGuamGuatemalaGuineaGuinea-BissauGuyanaHaitiHeavily indebted poor countries (HIPC)High incomeHondurasHong Kong SAR, ChinaHungaryIBRD onlyIcelandIDA & IBRD totalIDA blendIDA onlyIDA totalIndiaIndonesiaIran, Islamic Rep.IraqIrelandIsle of ManIsraelItalyJamaicaJapanJordanKazakhstanKenyaKiribatiKorea, Dem. People’s Rep.Korea, Rep.KuwaitKyrgyz RepublicLao PDRLate-demographic dividendLatin America & Caribbean Latin America & Caribbean (excluding high income)Latin America & the Caribbean (IDA & IBRD countries)LatviaLeast developed countries: UN classificationLebanonLesothoLiberiaLibyaLiechtensteinLithuaniaLow & middle incomeLow incomeLower middle incomeLuxembourgMacao SAR, ChinaMacedonia, FYRMadagascarMalawiMalaysiaMaldivesMaliMaltaMarshall IslandsMauritaniaMauritiusMexicoMicronesia, Fed. Sts.Middle East & North AfricaMiddle East & North Africa (excluding high income)Middle East & North Africa (IDA & IBRD countries)Middle incomeMoldovaMonacoMongoliaMontenegroMoroccoMozambiqueMyanmarNamibiaNauruNepalNetherlandsNew CaledoniaNew ZealandNicaraguaNigerNigeriaNorth AmericaNorthern Mariana IslandsNorwayOECD membersOmanOther small statesPacific island small statesPakistanPalauPanamaPapua New GuineaParaguayPeruPhilippinesPolandPortugalPost-demographic dividendPre-demographic dividendPuerto RicoQatarRomaniaRussian FederationRwandaSamoaSan MarinoSao Tome and PrincipeSaudi ArabiaSenegalSerbiaSeychellesSierra LeoneSingaporeSint Maarten (Dutch part)Slovak RepublicSloveniaSmall statesSolomon IslandsSomaliaSouth AfricaSouth AsiaSouth Asia (IDA & IBRD)South SudanSpainSri LankaSt. Kitts and NevisSt. LuciaSt. Vincent and the GrenadinesSub-Saharan Africa Sub-Saharan Africa (excluding high income)Sub-Saharan Africa (IDA & IBRD countries)SudanSurinameSwazilandSwedenSwitzerlandSyrian Arab RepublicTajikistanTanzaniaThailandTimor-LesteTogoTongaTrinidad and TobagoTunisiaTurkeyTurkmenistanTurks and Caicos IslandsTuvaluUgandaUkraineUnited Arab EmiratesUnited KingdomUnited StatesUpper middle incomeUruguayUzbekistanVanuatuVenezuela, RBVietnamVirgin Islands (U.S.)West Bank and GazaWorldYemen, Rep.ZambiaZimbabwe Timeline:
This timeline shows a graph from 1961 to 2016 of Channel Islands. No data until 1960. Number of actual observations by date: 56.
Source name:
World Development Indicators
Source organization:
World Bank Staff estimates based on United Nations, World Urbanization Prospects.
Categories, topics:
Agriculture & Rural Development
Last updated:
apr 23, 2017
Indicators value changes by year
At the date of observation
Value
Absolute change
Change from previous value
jan 1, 1961
61.3
+61.3
0.0%
jan 1, 1962
61.564
+0.264
0.43%
jan 1, 1963
61.828
+0.264
0.43%
jan 1, 1964
62.091
+0.263
0.43%
jan 1, 1965
62.354
+0.263
0.42%
jan 1, 1966
62.615
+0.261
0.42%
jan 1, 1967
62.876
+0.261
0.42%
jan 1, 1968
63.136
+0.26
0.41%
jan 1, 1969
63.396
+0.26
0.41%
jan 1, 1970
63.654
+0.258
0.41%
jan 1, 1971
63.912
+0.258
0.41%
jan 1, 1972
64.197
+0.285
0.45%
jan 1, 1973
64.606
+0.409
0.64%
jan 1, 1974
65.011
+0.405
0.63%
jan 1, 1975
65.415
+0.404
0.62%
jan 1, 1976
65.817
+0.402
0.61%
jan 1, 1977
66.217
+0.4
0.61%
jan 1, 1978
66.613
+0.396
0.6%
jan 1, 1979
67.008
+0.395
0.59%
jan 1, 1980
67.401
+0.393
0.59%
jan 1, 1981
67.791
+0.39
0.58%
jan 1, 1982
68.091
+0.3
0.44%
jan 1, 1983
68.11
+0.019
0.03%
jan 1, 1984
68.129
+0.019
0.03%
jan 1, 1985
68.149
+0.02
0.03%
jan 1, 1986
68.168
+0.019
0.03%
jan 1, 1987
68.187
+0.019
0.03%
jan 1, 1988
68.293
+0.106
0.16%
jan 1, 1989
68.398
+0.105
0.15%
jan 1, 1990
68.503
+0.105
0.15%
jan 1, 1991
68.608
+0.105
0.15%
jan 1, 1992
68.738
+0.13
0.19%
jan 1, 1993
68.924
+0.186
0.27%
jan 1, 1994
69.109
+0.185
0.27%
jan 1, 1995
69.294
+0.185
0.27%
jan 1, 1996
69.478
+0.184
0.27%
jan 1, 1997
69.6
+0.122
0.18%
jan 1, 1998
69.584
-0.016
-0.02%
jan 1, 1999
69.568
-0.016
-0.02%
jan 1, 2000
69.551
-0.017
-0.02%
jan 1, 2001
69.535
-0.016
-0.02%
jan 1, 2002
69.505
-0.03
-0.04%
jan 1, 2003
69.443
-0.062
-0.09%
jan 1, 2004
69.381
-0.062
-0.09%
jan 1, 2005
69.319
-0.062
-0.09%
jan 1, 2006
69.257
-0.062
-0.09%
jan 1, 2007
69.195
-0.062
-0.09%
jan 1, 2008
69.133
-0.062
-0.09%
jan 1, 2009
69.071
-0.062
-0.09%
jan 1, 2010
69.008
-0.063
-0.09%
jan 1, 2011
68.946
-0.062
-0.09%
jan 1, 2012
68.884
-0.062
-0.09%
jan 1, 2013
68.811
-0.073
-0.11%
jan 1, 2014
68.729
-0.082
-0.12%
jan 1, 2015
68.637
-0.092
-0.13%
jan 1, 2016
68.535
-0.102
-0.15%
Ranking of countries by current statistics by years


Comments: