29
/
en
AIzaSyAYiBZKx7MnpbEhh9jyipgxe19OcubqV5w
April 1, 2024
87926
Bolivia
BOL
true
2
1
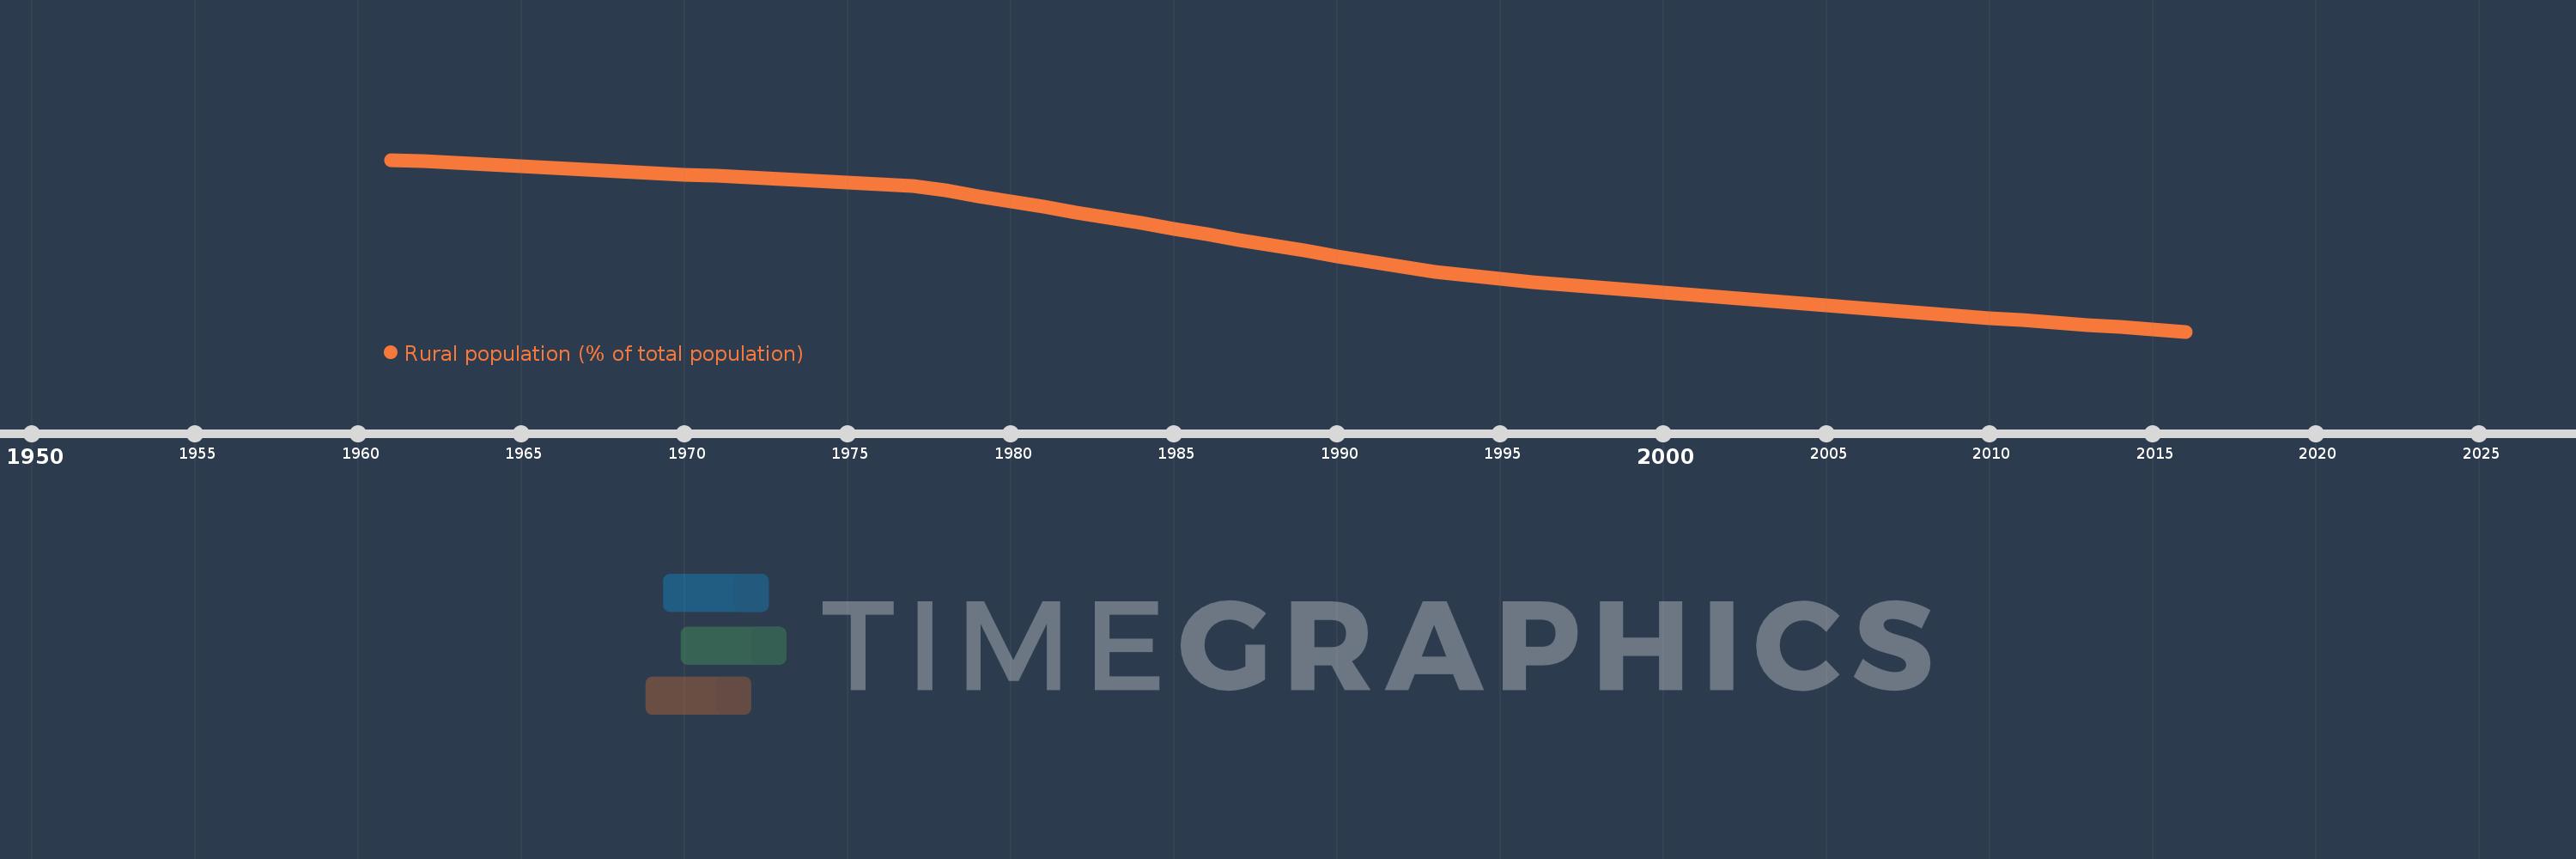
Rural population (% of total population)
2016,2015,2014,2013,2012,2011,2010,2009,2008,2007,2006,2005,2004,2003,2002,2001,2000,1999,1998,1997,1996,1995,1994,1993,1992,1991,1990,1989,1988,1987,1986,1985,1984,1983,1982,1981,1980,1979,1978,1977,1976,1975,1974,1973,1972,1971,1970,1969,1968,1967,1966,1965,1964,1963,1962,1961
This statistics in other country:
AfghanistanAlbaniaAlgeriaAmerican SamoaAndorraAngolaAntigua and BarbudaArab WorldArgentinaArmeniaArubaAustraliaAustriaAzerbaijanBahamas, TheBahrainBangladeshBarbadosBelarusBelgiumBelizeBeninBermudaBhutanBoliviaBosnia and HerzegovinaBotswanaBrazilBritish Virgin IslandsBrunei DarussalamBulgariaBurkina FasoBurundiCabo VerdeCambodiaCameroonCanadaCaribbean small statesCayman IslandsCentral African RepublicCentral Europe and the BalticsChadChannel IslandsChileChinaColombiaComorosCongo, Dem. Rep.Congo, Rep.Costa RicaCote d'IvoireCroatiaCubaCuracaoCyprusCzech RepublicDenmarkDjiboutiDominicaDominican RepublicEarly-demographic dividendEast Asia & PacificEast Asia & Pacific (excluding high income)East Asia & Pacific (IDA & IBRD countries)EcuadorEgypt, Arab Rep.El SalvadorEquatorial GuineaEritreaEstoniaEthiopiaEuro areaEurope & Central AsiaEurope & Central Asia (excluding high income)Europe & Central Asia (IDA & IBRD countries)European UnionFaroe IslandsFijiFinlandFragile and conflict affected situationsFranceFrench PolynesiaGabonGambia, TheGeorgiaGermanyGhanaGibraltarGreeceGreenlandGrenadaGuamGuatemalaGuineaGuinea-BissauGuyanaHaitiHeavily indebted poor countries (HIPC)High incomeHondurasHong Kong SAR, ChinaHungaryIBRD onlyIcelandIDA & IBRD totalIDA blendIDA onlyIDA totalIndiaIndonesiaIran, Islamic Rep.IraqIrelandIsle of ManIsraelItalyJamaicaJapanJordanKazakhstanKenyaKiribatiKorea, Dem. People’s Rep.Korea, Rep.KuwaitKyrgyz RepublicLao PDRLate-demographic dividendLatin America & Caribbean Latin America & Caribbean (excluding high income)Latin America & the Caribbean (IDA & IBRD countries)LatviaLeast developed countries: UN classificationLebanonLesothoLiberiaLibyaLiechtensteinLithuaniaLow & middle incomeLow incomeLower middle incomeLuxembourgMacao SAR, ChinaMacedonia, FYRMadagascarMalawiMalaysiaMaldivesMaliMaltaMarshall IslandsMauritaniaMauritiusMexicoMicronesia, Fed. Sts.Middle East & North AfricaMiddle East & North Africa (excluding high income)Middle East & North Africa (IDA & IBRD countries)Middle incomeMoldovaMonacoMongoliaMontenegroMoroccoMozambiqueMyanmarNamibiaNauruNepalNetherlandsNew CaledoniaNew ZealandNicaraguaNigerNigeriaNorth AmericaNorthern Mariana IslandsNorwayOECD membersOmanOther small statesPacific island small statesPakistanPalauPanamaPapua New GuineaParaguayPeruPhilippinesPolandPortugalPost-demographic dividendPre-demographic dividendPuerto RicoQatarRomaniaRussian FederationRwandaSamoaSan MarinoSao Tome and PrincipeSaudi ArabiaSenegalSerbiaSeychellesSierra LeoneSingaporeSint Maarten (Dutch part)Slovak RepublicSloveniaSmall statesSolomon IslandsSomaliaSouth AfricaSouth AsiaSouth Asia (IDA & IBRD)South SudanSpainSri LankaSt. Kitts and NevisSt. LuciaSt. Vincent and the GrenadinesSub-Saharan Africa Sub-Saharan Africa (excluding high income)Sub-Saharan Africa (IDA & IBRD countries)SudanSurinameSwazilandSwedenSwitzerlandSyrian Arab RepublicTajikistanTanzaniaThailandTimor-LesteTogoTongaTrinidad and TobagoTunisiaTurkeyTurkmenistanTurks and Caicos IslandsTuvaluUgandaUkraineUnited Arab EmiratesUnited KingdomUnited StatesUpper middle incomeUruguayUzbekistanVanuatuVenezuela, RBVietnamVirgin Islands (U.S.)West Bank and GazaWorldYemen, Rep.ZambiaZimbabwe Timeline:
This timeline shows a graph from 1961 to 2016 of Bolivia. No data until 1960. Number of actual observations by date: 56.
Source name:
World Development Indicators
Source organization:
World Bank Staff estimates based on United Nations, World Urbanization Prospects.
Categories, topics:
Agriculture & Rural Development
Last updated:
apr 23, 2017
Indicators value changes by year
Minimum:
31.488
jan 1, 2016
Maximum:
63.238
jan 1, 1961
At the date of observation
Value
Absolute change
Change from previous value
jan 1, 1961
63.238
+63.238
0.0%
jan 1, 1962
62.941
-0.297
-0.47%
jan 1, 1963
62.643
-0.298
-0.47%
jan 1, 1964
62.344
-0.299
-0.48%
jan 1, 1965
62.043
-0.301
-0.48%
jan 1, 1966
61.743
-0.3
-0.48%
jan 1, 1967
61.441
-0.302
-0.49%
jan 1, 1968
61.138
-0.303
-0.49%
jan 1, 1969
60.834
-0.304
-0.5%
jan 1, 1970
60.53
-0.304
-0.5%
jan 1, 1971
60.224
-0.306
-0.51%
jan 1, 1972
59.918
-0.306
-0.51%
jan 1, 1973
59.611
-0.307
-0.51%
jan 1, 1974
59.304
-0.307
-0.52%
jan 1, 1975
58.996
-0.308
-0.52%
jan 1, 1976
58.686
-0.31
-0.53%
jan 1, 1977
58.376
-0.31
-0.53%
jan 1, 1978
57.554
-0.822
-1.41%
jan 1, 1979
56.558
-0.996
-1.73%
jan 1, 1980
55.557
-1.001
-1.77%
jan 1, 1981
54.549
-1.008
-1.81%
jan 1, 1982
53.541
-1.008
-1.85%
jan 1, 1983
52.528
-1.013
-1.89%
jan 1, 1984
51.514
-1.014
-1.93%
jan 1, 1985
50.496
-1.018
-1.98%
jan 1, 1986
49.481
-1.015
-2.01%
jan 1, 1987
48.465
-1.016
-2.05%
jan 1, 1988
47.451
-1.014
-2.09%
jan 1, 1989
46.437
-1.014
-2.14%
jan 1, 1990
45.429
-1.008
-2.17%
jan 1, 1991
44.423
-1.006
-2.21%
jan 1, 1992
43.421
-1.002
-2.26%
jan 1, 1993
42.452
-0.969
-2.23%
jan 1, 1994
41.833
-0.619
-1.46%
jan 1, 1995
41.215
-0.618
-1.48%
jan 1, 1996
40.6
-0.615
-1.49%
jan 1, 1997
40.109
-0.491
-1.21%
jan 1, 1998
39.62
-0.489
-1.22%
jan 1, 1999
39.134
-0.486
-1.23%
jan 1, 2000
38.649
-0.485
-1.24%
jan 1, 2001
38.166
-0.483
-1.25%
jan 1, 2002
37.687
-0.479
-1.26%
jan 1, 2003
37.209
-0.478
-1.27%
jan 1, 2004
36.736
-0.473
-1.27%
jan 1, 2005
36.268
-0.468
-1.27%
jan 1, 2006
35.806
-0.462
-1.27%
jan 1, 2007
35.348
-0.458
-1.28%
jan 1, 2008
34.896
-0.452
-1.28%
jan 1, 2009
34.45
-0.446
-1.28%
jan 1, 2010
34.009
-0.441
-1.28%
jan 1, 2011
33.574
-0.435
-1.28%
jan 1, 2012
33.145
-0.429
-1.28%
jan 1, 2013
32.721
-0.424
-1.28%
jan 1, 2014
32.304
-0.417
-1.27%
jan 1, 2015
31.893
-0.411
-1.27%
jan 1, 2016
31.488
-0.405
-1.27%
Ranking of countries by current statistics by years


Comments: