29
/
en
AIzaSyAYiBZKx7MnpbEhh9jyipgxe19OcubqV5w
April 1, 2024
25297
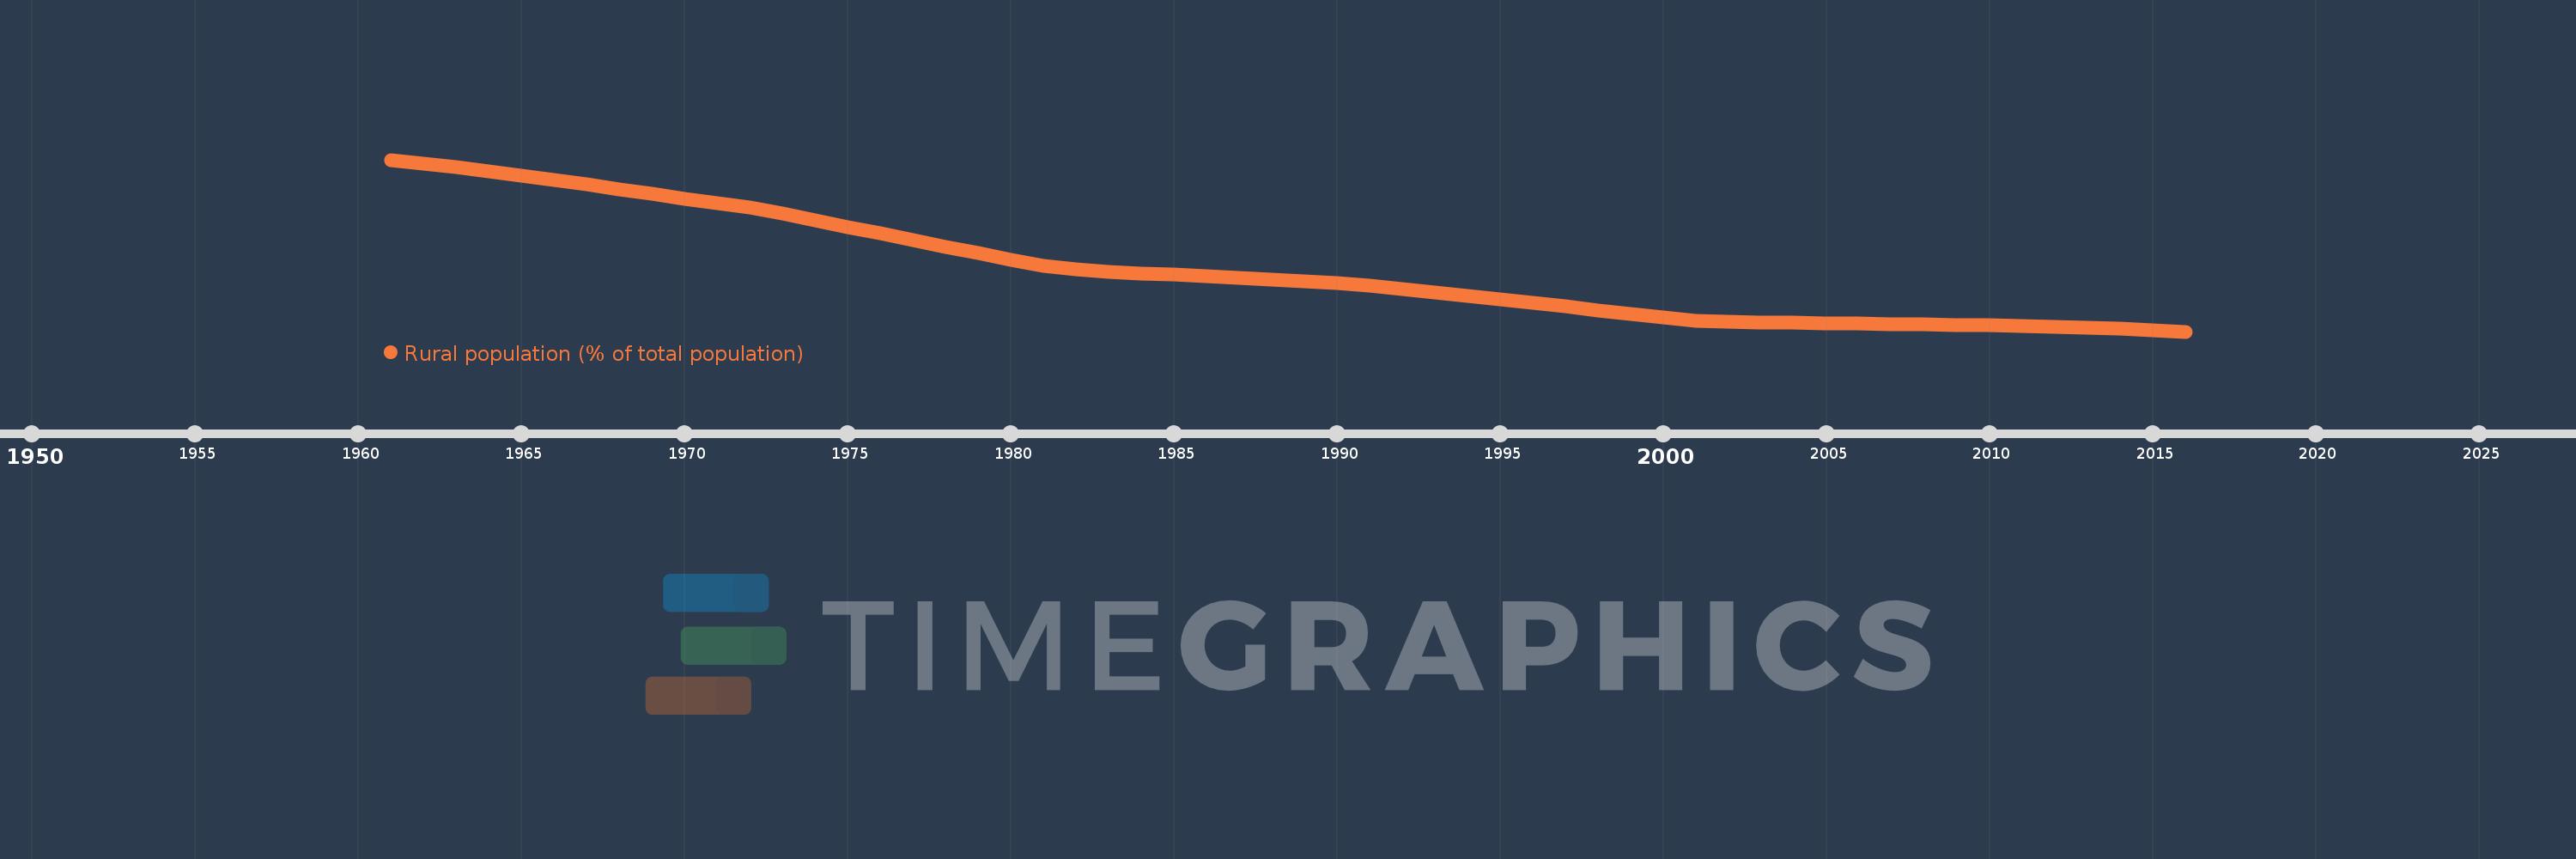
Caribbean small states
CSS
false
2
1
Rural population (% of total population)
2016,2015,2014,2013,2012,2011,2010,2009,2008,2007,2006,2005,2004,2003,2002,2001,2000,1999,1998,1997,1996,1995,1994,1993,1992,1991,1990,1989,1988,1987,1986,1985,1984,1983,1982,1981,1980,1979,1978,1977,1976,1975,1974,1973,1972,1971,1970,1969,1968,1967,1966,1965,1964,1963,1962,1961
This statistics in other country:
AfghanistanAlbaniaAlgeriaAmerican SamoaAndorraAngolaAntigua and BarbudaArab WorldArgentinaArmeniaArubaAustraliaAustriaAzerbaijanBahamas, TheBahrainBangladeshBarbadosBelarusBelgiumBelizeBeninBermudaBhutanBoliviaBosnia and HerzegovinaBotswanaBrazilBritish Virgin IslandsBrunei DarussalamBulgariaBurkina FasoBurundiCabo VerdeCambodiaCameroonCanadaCaribbean small statesCayman IslandsCentral African RepublicCentral Europe and the BalticsChadChannel IslandsChileChinaColombiaComorosCongo, Dem. Rep.Congo, Rep.Costa RicaCote d'IvoireCroatiaCubaCuracaoCyprusCzech RepublicDenmarkDjiboutiDominicaDominican RepublicEarly-demographic dividendEast Asia & PacificEast Asia & Pacific (excluding high income)East Asia & Pacific (IDA & IBRD countries)EcuadorEgypt, Arab Rep.El SalvadorEquatorial GuineaEritreaEstoniaEthiopiaEuro areaEurope & Central AsiaEurope & Central Asia (excluding high income)Europe & Central Asia (IDA & IBRD countries)European UnionFaroe IslandsFijiFinlandFragile and conflict affected situationsFranceFrench PolynesiaGabonGambia, TheGeorgiaGermanyGhanaGibraltarGreeceGreenlandGrenadaGuamGuatemalaGuineaGuinea-BissauGuyanaHaitiHeavily indebted poor countries (HIPC)High incomeHondurasHong Kong SAR, ChinaHungaryIBRD onlyIcelandIDA & IBRD totalIDA blendIDA onlyIDA totalIndiaIndonesiaIran, Islamic Rep.IraqIrelandIsle of ManIsraelItalyJamaicaJapanJordanKazakhstanKenyaKiribatiKorea, Dem. People’s Rep.Korea, Rep.KuwaitKyrgyz RepublicLao PDRLate-demographic dividendLatin America & Caribbean Latin America & Caribbean (excluding high income)Latin America & the Caribbean (IDA & IBRD countries)LatviaLeast developed countries: UN classificationLebanonLesothoLiberiaLibyaLiechtensteinLithuaniaLow & middle incomeLow incomeLower middle incomeLuxembourgMacao SAR, ChinaMacedonia, FYRMadagascarMalawiMalaysiaMaldivesMaliMaltaMarshall IslandsMauritaniaMauritiusMexicoMicronesia, Fed. Sts.Middle East & North AfricaMiddle East & North Africa (excluding high income)Middle East & North Africa (IDA & IBRD countries)Middle incomeMoldovaMonacoMongoliaMontenegroMoroccoMozambiqueMyanmarNamibiaNauruNepalNetherlandsNew CaledoniaNew ZealandNicaraguaNigerNigeriaNorth AmericaNorthern Mariana IslandsNorwayOECD membersOmanOther small statesPacific island small statesPakistanPalauPanamaPapua New GuineaParaguayPeruPhilippinesPolandPortugalPost-demographic dividendPre-demographic dividendPuerto RicoQatarRomaniaRussian FederationRwandaSamoaSan MarinoSao Tome and PrincipeSaudi ArabiaSenegalSerbiaSeychellesSierra LeoneSingaporeSint Maarten (Dutch part)Slovak RepublicSloveniaSmall statesSolomon IslandsSomaliaSouth AfricaSouth AsiaSouth Asia (IDA & IBRD)South SudanSpainSri LankaSt. Kitts and NevisSt. LuciaSt. Vincent and the GrenadinesSub-Saharan Africa Sub-Saharan Africa (excluding high income)Sub-Saharan Africa (IDA & IBRD countries)SudanSurinameSwazilandSwedenSwitzerlandSyrian Arab RepublicTajikistanTanzaniaThailandTimor-LesteTogoTongaTrinidad and TobagoTunisiaTurkeyTurkmenistanTurks and Caicos IslandsTuvaluUgandaUkraineUnited Arab EmiratesUnited KingdomUnited StatesUpper middle incomeUruguayUzbekistanVanuatuVenezuela, RBVietnamVirgin Islands (U.S.)West Bank and GazaWorldYemen, Rep.ZambiaZimbabwe Timeline:
This timeline shows a graph from 1961 to 2016 of Caribbean small states. No data until 1960. Number of actual observations by date: 56.
Source name:
World Development Indicators
Source organization:
World Bank Staff estimates based on United Nations, World Urbanization Prospects.
Categories, topics:
Agriculture & Rural Development
Last updated:
apr 23, 2017
Indicators value changes by year
Minimum:
57.827
jan 1, 2016
Maximum:
68.403
jan 1, 1961
At the date of observation
Value
Absolute change
Change from previous value
jan 1, 1961
68.403
+68.403
0.0%
jan 1, 1962
68.181
-0.222
-0.32%
jan 1, 1963
67.942
-0.239
-0.35%
jan 1, 1964
67.686
-0.256
-0.38%
jan 1, 1965
67.419
-0.267
-0.39%
jan 1, 1966
67.156
-0.264
-0.39%
jan 1, 1967
66.879
-0.277
-0.41%
jan 1, 1968
66.591
-0.288
-0.43%
jan 1, 1969
66.299
-0.292
-0.44%
jan 1, 1970
66.014
-0.286
-0.43%
jan 1, 1971
65.736
-0.277
-0.42%
jan 1, 1972
65.471
-0.266
-0.4%
jan 1, 1973
65.123
-0.348
-0.53%
jan 1, 1974
64.695
-0.428
-0.66%
jan 1, 1975
64.278
-0.417
-0.65%
jan 1, 1976
63.866
-0.412
-0.64%
jan 1, 1977
63.456
-0.41
-0.64%
jan 1, 1978
63.052
-0.404
-0.64%
jan 1, 1979
62.65
-0.402
-0.64%
jan 1, 1980
62.246
-0.404
-0.64%
jan 1, 1981
61.853
-0.393
-0.63%
jan 1, 1982
61.685
-0.168
-0.27%
jan 1, 1983
61.496
-0.189
-0.31%
jan 1, 1984
61.421
-0.075
-0.12%
jan 1, 1985
61.333
-0.088
-0.14%
jan 1, 1986
61.241
-0.093
-0.15%
jan 1, 1987
61.138
-0.102
-0.17%
jan 1, 1988
61.035
-0.103
-0.17%
jan 1, 1989
60.935
-0.1
-0.16%
jan 1, 1990
60.809
-0.126
-0.21%
jan 1, 1991
60.672
-0.136
-0.22%
jan 1, 1992
60.451
-0.221
-0.36%
jan 1, 1993
60.244
-0.207
-0.34%
jan 1, 1994
60.036
-0.208
-0.35%
jan 1, 1995
59.825
-0.211
-0.35%
jan 1, 1996
59.608
-0.217
-0.36%
jan 1, 1997
59.372
-0.237
-0.4%
jan 1, 1998
59.143
-0.229
-0.39%
jan 1, 1999
58.916
-0.227
-0.38%
jan 1, 2000
58.7
-0.216
-0.37%
jan 1, 2001
58.506
-0.194
-0.33%
jan 1, 2002
58.419
-0.087
-0.15%
jan 1, 2003
58.389
-0.031
-0.05%
jan 1, 2004
58.364
-0.024
-0.04%
jan 1, 2005
58.337
-0.028
-0.05%
jan 1, 2006
58.316
-0.021
-0.04%
jan 1, 2007
58.292
-0.024
-0.04%
jan 1, 2008
58.265
-0.027
-0.05%
jan 1, 2009
58.237
-0.028
-0.05%
jan 1, 2010
58.208
-0.029
-0.05%
jan 1, 2011
58.176
-0.032
-0.06%
jan 1, 2012
58.123
-0.053
-0.09%
jan 1, 2013
58.063
-0.06
-0.1%
jan 1, 2014
57.995
-0.068
-0.12%
jan 1, 2015
57.917
-0.078
-0.13%
jan 1, 2016
57.827
-0.09
-0.15%
Ranking of countries by current statistics by years


Comments: