29
/
en
AIzaSyAYiBZKx7MnpbEhh9jyipgxe19OcubqV5w
April 1, 2024
165513
Jordan
JOR
true
2
1
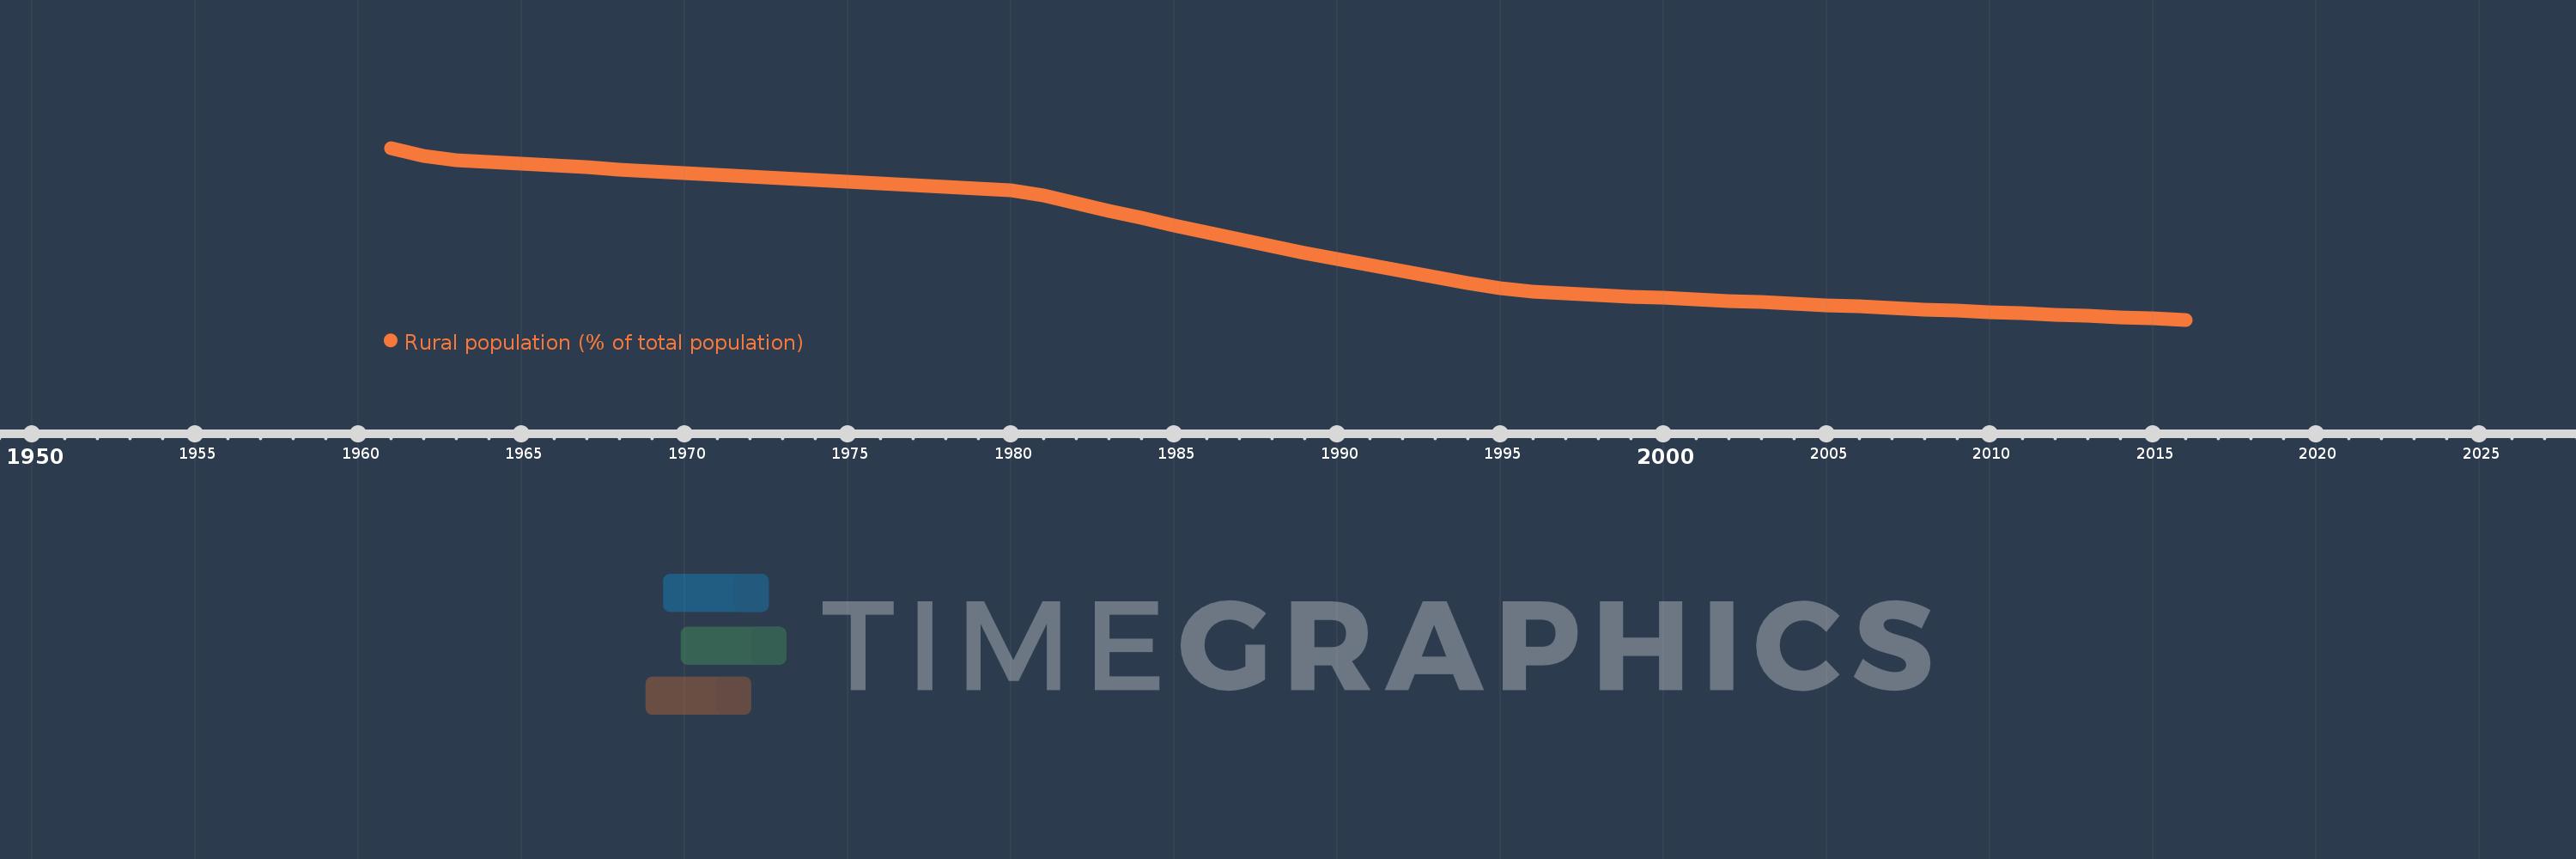
Rural population (% of total population)
2016,2015,2014,2013,2012,2011,2010,2009,2008,2007,2006,2005,2004,2003,2002,2001,2000,1999,1998,1997,1996,1995,1994,1993,1992,1991,1990,1989,1988,1987,1986,1985,1984,1983,1982,1981,1980,1979,1978,1977,1976,1975,1974,1973,1972,1971,1970,1969,1968,1967,1966,1965,1964,1963,1962,1961
This statistics in other country:
AfghanistanAlbaniaAlgeriaAmerican SamoaAndorraAngolaAntigua and BarbudaArab WorldArgentinaArmeniaArubaAustraliaAustriaAzerbaijanBahamas, TheBahrainBangladeshBarbadosBelarusBelgiumBelizeBeninBermudaBhutanBoliviaBosnia and HerzegovinaBotswanaBrazilBritish Virgin IslandsBrunei DarussalamBulgariaBurkina FasoBurundiCabo VerdeCambodiaCameroonCanadaCaribbean small statesCayman IslandsCentral African RepublicCentral Europe and the BalticsChadChannel IslandsChileChinaColombiaComorosCongo, Dem. Rep.Congo, Rep.Costa RicaCote d'IvoireCroatiaCubaCuracaoCyprusCzech RepublicDenmarkDjiboutiDominicaDominican RepublicEarly-demographic dividendEast Asia & PacificEast Asia & Pacific (excluding high income)East Asia & Pacific (IDA & IBRD countries)EcuadorEgypt, Arab Rep.El SalvadorEquatorial GuineaEritreaEstoniaEthiopiaEuro areaEurope & Central AsiaEurope & Central Asia (excluding high income)Europe & Central Asia (IDA & IBRD countries)European UnionFaroe IslandsFijiFinlandFragile and conflict affected situationsFranceFrench PolynesiaGabonGambia, TheGeorgiaGermanyGhanaGibraltarGreeceGreenlandGrenadaGuamGuatemalaGuineaGuinea-BissauGuyanaHaitiHeavily indebted poor countries (HIPC)High incomeHondurasHong Kong SAR, ChinaHungaryIBRD onlyIcelandIDA & IBRD totalIDA blendIDA onlyIDA totalIndiaIndonesiaIran, Islamic Rep.IraqIrelandIsle of ManIsraelItalyJamaicaJapanJordanKazakhstanKenyaKiribatiKorea, Dem. People’s Rep.Korea, Rep.KuwaitKyrgyz RepublicLao PDRLate-demographic dividendLatin America & Caribbean Latin America & Caribbean (excluding high income)Latin America & the Caribbean (IDA & IBRD countries)LatviaLeast developed countries: UN classificationLebanonLesothoLiberiaLibyaLiechtensteinLithuaniaLow & middle incomeLow incomeLower middle incomeLuxembourgMacao SAR, ChinaMacedonia, FYRMadagascarMalawiMalaysiaMaldivesMaliMaltaMarshall IslandsMauritaniaMauritiusMexicoMicronesia, Fed. Sts.Middle East & North AfricaMiddle East & North Africa (excluding high income)Middle East & North Africa (IDA & IBRD countries)Middle incomeMoldovaMonacoMongoliaMontenegroMoroccoMozambiqueMyanmarNamibiaNauruNepalNetherlandsNew CaledoniaNew ZealandNicaraguaNigerNigeriaNorth AmericaNorthern Mariana IslandsNorwayOECD membersOmanOther small statesPacific island small statesPakistanPalauPanamaPapua New GuineaParaguayPeruPhilippinesPolandPortugalPost-demographic dividendPre-demographic dividendPuerto RicoQatarRomaniaRussian FederationRwandaSamoaSan MarinoSao Tome and PrincipeSaudi ArabiaSenegalSerbiaSeychellesSierra LeoneSingaporeSint Maarten (Dutch part)Slovak RepublicSloveniaSmall statesSolomon IslandsSomaliaSouth AfricaSouth AsiaSouth Asia (IDA & IBRD)South SudanSpainSri LankaSt. Kitts and NevisSt. LuciaSt. Vincent and the GrenadinesSub-Saharan Africa Sub-Saharan Africa (excluding high income)Sub-Saharan Africa (IDA & IBRD countries)SudanSurinameSwazilandSwedenSwitzerlandSyrian Arab RepublicTajikistanTanzaniaThailandTimor-LesteTogoTongaTrinidad and TobagoTunisiaTurkeyTurkmenistanTurks and Caicos IslandsTuvaluUgandaUkraineUnited Arab EmiratesUnited KingdomUnited StatesUpper middle incomeUruguayUzbekistanVanuatuVenezuela, RBVietnamVirgin Islands (U.S.)West Bank and GazaWorldYemen, Rep.ZambiaZimbabwe Timeline:
This timeline shows a graph from 1961 to 2016 of Jordan. No data until 1960. Number of actual observations by date: 56.
Source name:
World Development Indicators
Source organization:
World Bank Staff estimates based on United Nations, World Urbanization Prospects.
Categories, topics:
Agriculture & Rural Development
Last updated:
apr 23, 2017
Indicators value changes by year
Minimum:
16.321
jan 1, 2016
Maximum:
49.121
jan 1, 1961
At the date of observation
Value
Absolute change
Change from previous value
jan 1, 1961
49.121
+49.121
0.0%
jan 1, 1962
47.588
-1.533
-3.12%
jan 1, 1963
46.785
-0.803
-1.69%
jan 1, 1964
46.435
-0.35
-0.75%
jan 1, 1965
46.086
-0.349
-0.75%
jan 1, 1966
45.738
-0.348
-0.76%
jan 1, 1967
45.39
-0.348
-0.76%
jan 1, 1968
45.043
-0.347
-0.76%
jan 1, 1969
44.704
-0.339
-0.75%
jan 1, 1970
44.367
-0.337
-0.75%
jan 1, 1971
44.029
-0.338
-0.76%
jan 1, 1972
43.692
-0.337
-0.77%
jan 1, 1973
43.355
-0.337
-0.77%
jan 1, 1974
43.02
-0.335
-0.77%
jan 1, 1975
42.685
-0.335
-0.78%
jan 1, 1976
42.35
-0.335
-0.78%
jan 1, 1977
42.016
-0.334
-0.79%
jan 1, 1978
41.684
-0.332
-0.79%
jan 1, 1979
41.351
-0.333
-0.8%
jan 1, 1980
41.02
-0.331
-0.8%
jan 1, 1981
39.971
-1.049
-2.56%
jan 1, 1982
38.536
-1.435
-3.59%
jan 1, 1983
37.118
-1.418
-3.68%
jan 1, 1984
35.722
-1.396
-3.76%
jan 1, 1985
34.348
-1.374
-3.85%
jan 1, 1986
33.004
-1.344
-3.91%
jan 1, 1987
31.685
-1.319
-4.0%
jan 1, 1988
30.394
-1.291
-4.07%
jan 1, 1989
29.132
-1.262
-4.15%
jan 1, 1990
27.905
-1.227
-4.21%
jan 1, 1991
26.709
-1.196
-4.29%
jan 1, 1992
25.545
-1.164
-4.36%
jan 1, 1993
24.414
-1.131
-4.43%
jan 1, 1994
23.32
-1.094
-4.48%
jan 1, 1995
22.26
-1.06
-4.55%
jan 1, 1996
21.635
-0.625
-2.81%
jan 1, 1997
21.34
-0.295
-1.36%
jan 1, 1998
21.049
-0.291
-1.36%
jan 1, 1999
20.761
-0.288
-1.37%
jan 1, 2000
20.475
-0.286
-1.38%
jan 1, 2001
20.192
-0.283
-1.38%
jan 1, 2002
19.913
-0.279
-1.38%
jan 1, 2003
19.636
-0.277
-1.39%
jan 1, 2004
19.362
-0.274
-1.4%
jan 1, 2005
19.091
-0.271
-1.4%
jan 1, 2006
18.823
-0.268
-1.4%
jan 1, 2007
18.558
-0.265
-1.41%
jan 1, 2008
18.296
-0.262
-1.41%
jan 1, 2009
18.036
-0.26
-1.42%
jan 1, 2010
17.78
-0.256
-1.42%
jan 1, 2011
17.527
-0.253
-1.42%
jan 1, 2012
17.276
-0.251
-1.43%
jan 1, 2013
17.03
-0.246
-1.42%
jan 1, 2014
16.789
-0.241
-1.42%
jan 1, 2015
16.553
-0.236
-1.41%
jan 1, 2016
16.321
-0.232
-1.4%
Ranking of countries by current statistics by years


Comments: