29
/
en
AIzaSyAYiBZKx7MnpbEhh9jyipgxe19OcubqV5w
April 1, 2024
208409
Netherlands
NLD
true
2
1
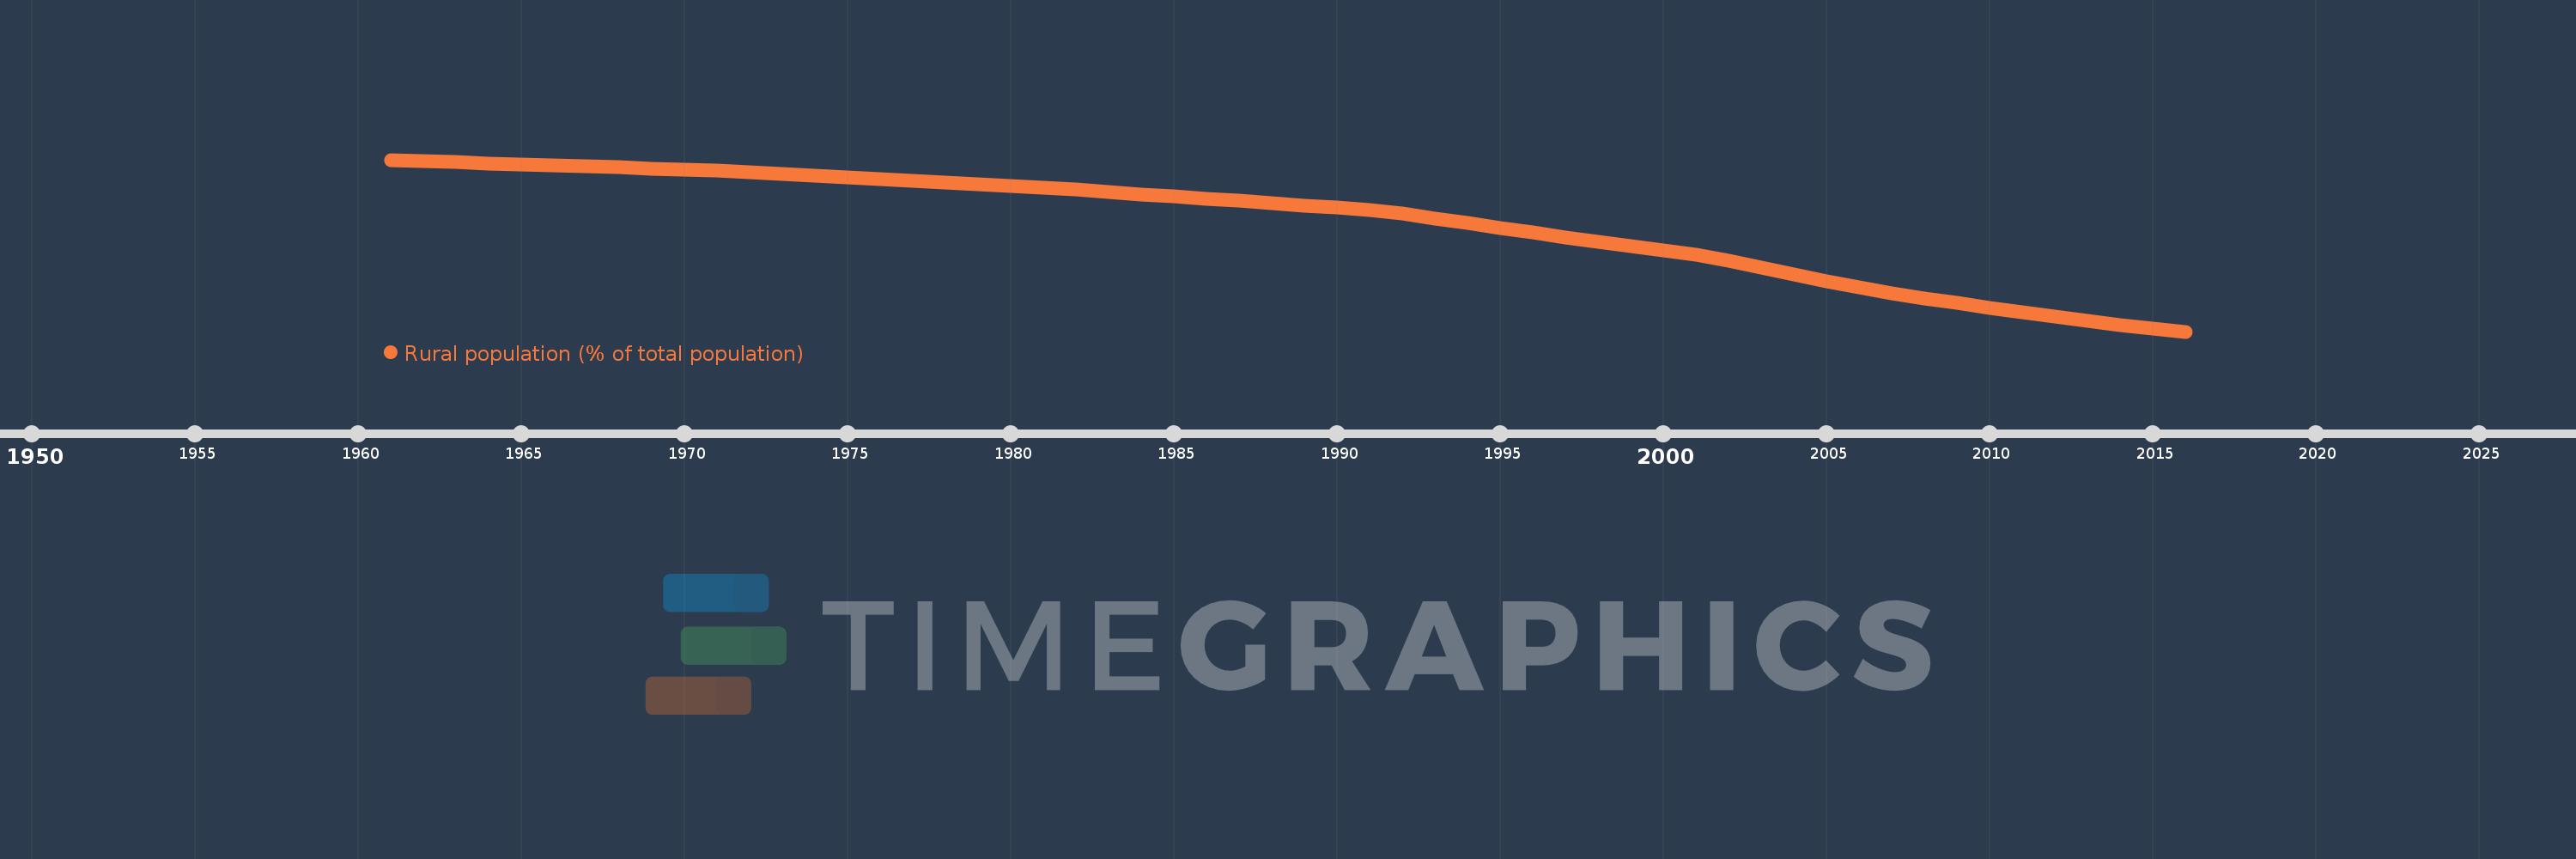
Rural population (% of total population)
2016,2015,2014,2013,2012,2011,2010,2009,2008,2007,2006,2005,2004,2003,2002,2001,2000,1999,1998,1997,1996,1995,1994,1993,1992,1991,1990,1989,1988,1987,1986,1985,1984,1983,1982,1981,1980,1979,1978,1977,1976,1975,1974,1973,1972,1971,1970,1969,1968,1967,1966,1965,1964,1963,1962,1961
This statistics in other country:
AfghanistanAlbaniaAlgeriaAmerican SamoaAndorraAngolaAntigua and BarbudaArab WorldArgentinaArmeniaArubaAustraliaAustriaAzerbaijanBahamas, TheBahrainBangladeshBarbadosBelarusBelgiumBelizeBeninBermudaBhutanBoliviaBosnia and HerzegovinaBotswanaBrazilBritish Virgin IslandsBrunei DarussalamBulgariaBurkina FasoBurundiCabo VerdeCambodiaCameroonCanadaCaribbean small statesCayman IslandsCentral African RepublicCentral Europe and the BalticsChadChannel IslandsChileChinaColombiaComorosCongo, Dem. Rep.Congo, Rep.Costa RicaCote d'IvoireCroatiaCubaCuracaoCyprusCzech RepublicDenmarkDjiboutiDominicaDominican RepublicEarly-demographic dividendEast Asia & PacificEast Asia & Pacific (excluding high income)East Asia & Pacific (IDA & IBRD countries)EcuadorEgypt, Arab Rep.El SalvadorEquatorial GuineaEritreaEstoniaEthiopiaEuro areaEurope & Central AsiaEurope & Central Asia (excluding high income)Europe & Central Asia (IDA & IBRD countries)European UnionFaroe IslandsFijiFinlandFragile and conflict affected situationsFranceFrench PolynesiaGabonGambia, TheGeorgiaGermanyGhanaGibraltarGreeceGreenlandGrenadaGuamGuatemalaGuineaGuinea-BissauGuyanaHaitiHeavily indebted poor countries (HIPC)High incomeHondurasHong Kong SAR, ChinaHungaryIBRD onlyIcelandIDA & IBRD totalIDA blendIDA onlyIDA totalIndiaIndonesiaIran, Islamic Rep.IraqIrelandIsle of ManIsraelItalyJamaicaJapanJordanKazakhstanKenyaKiribatiKorea, Dem. People’s Rep.Korea, Rep.KuwaitKyrgyz RepublicLao PDRLate-demographic dividendLatin America & Caribbean Latin America & Caribbean (excluding high income)Latin America & the Caribbean (IDA & IBRD countries)LatviaLeast developed countries: UN classificationLebanonLesothoLiberiaLibyaLiechtensteinLithuaniaLow & middle incomeLow incomeLower middle incomeLuxembourgMacao SAR, ChinaMacedonia, FYRMadagascarMalawiMalaysiaMaldivesMaliMaltaMarshall IslandsMauritaniaMauritiusMexicoMicronesia, Fed. Sts.Middle East & North AfricaMiddle East & North Africa (excluding high income)Middle East & North Africa (IDA & IBRD countries)Middle incomeMoldovaMonacoMongoliaMontenegroMoroccoMozambiqueMyanmarNamibiaNauruNepalNetherlandsNew CaledoniaNew ZealandNicaraguaNigerNigeriaNorth AmericaNorthern Mariana IslandsNorwayOECD membersOmanOther small statesPacific island small statesPakistanPalauPanamaPapua New GuineaParaguayPeruPhilippinesPolandPortugalPost-demographic dividendPre-demographic dividendPuerto RicoQatarRomaniaRussian FederationRwandaSamoaSan MarinoSao Tome and PrincipeSaudi ArabiaSenegalSerbiaSeychellesSierra LeoneSingaporeSint Maarten (Dutch part)Slovak RepublicSloveniaSmall statesSolomon IslandsSomaliaSouth AfricaSouth AsiaSouth Asia (IDA & IBRD)South SudanSpainSri LankaSt. Kitts and NevisSt. LuciaSt. Vincent and the GrenadinesSub-Saharan Africa Sub-Saharan Africa (excluding high income)Sub-Saharan Africa (IDA & IBRD countries)SudanSurinameSwazilandSwedenSwitzerlandSyrian Arab RepublicTajikistanTanzaniaThailandTimor-LesteTogoTongaTrinidad and TobagoTunisiaTurkeyTurkmenistanTurks and Caicos IslandsTuvaluUgandaUkraineUnited Arab EmiratesUnited KingdomUnited StatesUpper middle incomeUruguayUzbekistanVanuatuVenezuela, RBVietnamVirgin Islands (U.S.)West Bank and GazaWorldYemen, Rep.ZambiaZimbabwe Timeline:
This timeline shows a graph from 1961 to 2016 of Netherlands. No data until 1960. Number of actual observations by date: 56.
Source name:
World Development Indicators
Source organization:
World Bank Staff estimates based on United Nations, World Urbanization Prospects.
Categories, topics:
Agriculture & Rural Development
Last updated:
apr 23, 2017
Indicators value changes by year
Maximum:
40.248
jan 1, 1961
At the date of observation
Value
Absolute change
Change from previous value
jan 1, 1961
40.248
+40.248
0.0%
jan 1, 1962
39.98
-0.268
-0.67%
jan 1, 1963
39.796
-0.184
-0.46%
jan 1, 1964
39.613
-0.183
-0.46%
jan 1, 1965
39.43
-0.183
-0.46%
jan 1, 1966
39.247
-0.183
-0.46%
jan 1, 1967
39.064
-0.183
-0.47%
jan 1, 1968
38.882
-0.182
-0.47%
jan 1, 1969
38.7
-0.182
-0.47%
jan 1, 1970
38.519
-0.181
-0.47%
jan 1, 1971
38.337
-0.182
-0.47%
jan 1, 1972
38.087
-0.25
-0.65%
jan 1, 1973
37.768
-0.319
-0.84%
jan 1, 1974
37.45
-0.318
-0.84%
jan 1, 1975
37.133
-0.317
-0.85%
jan 1, 1976
36.817
-0.316
-0.85%
jan 1, 1977
36.502
-0.315
-0.86%
jan 1, 1978
36.189
-0.313
-0.86%
jan 1, 1979
35.877
-0.312
-0.86%
jan 1, 1980
35.565
-0.312
-0.87%
jan 1, 1981
35.255
-0.31
-0.87%
jan 1, 1982
34.896
-0.359
-1.02%
jan 1, 1983
34.489
-0.407
-1.17%
jan 1, 1984
34.084
-0.405
-1.17%
jan 1, 1985
33.681
-0.403
-1.18%
jan 1, 1986
33.281
-0.4
-1.19%
jan 1, 1987
32.883
-0.398
-1.2%
jan 1, 1988
32.487
-0.396
-1.2%
jan 1, 1989
32.094
-0.393
-1.21%
jan 1, 1990
31.704
-0.39
-1.22%
jan 1, 1991
31.316
-0.388
-1.22%
jan 1, 1992
30.671
-0.645
-2.06%
jan 1, 1993
29.777
-0.894
-2.91%
jan 1, 1994
28.9
-0.877
-2.95%
jan 1, 1995
28.038
-0.862
-2.98%
jan 1, 1996
27.191
-0.847
-3.02%
jan 1, 1997
26.36
-0.831
-3.06%
jan 1, 1998
25.547
-0.813
-3.08%
jan 1, 1999
24.75
-0.797
-3.12%
jan 1, 2000
23.97
-0.78
-3.15%
jan 1, 2001
23.205
-0.765
-3.19%
jan 1, 2002
22.17
-1.035
-4.46%
jan 1, 2003
20.887
-1.283
-5.79%
jan 1, 2004
19.659
-1.228
-5.88%
jan 1, 2005
18.486
-1.173
-5.97%
jan 1, 2006
17.37
-1.116
-6.04%
jan 1, 2007
16.364
-1.006
-5.79%
jan 1, 2008
15.461
-0.903
-5.52%
jan 1, 2009
14.598
-0.863
-5.58%
jan 1, 2010
13.758
-0.84
-5.75%
jan 1, 2011
12.939
-0.819
-5.95%
jan 1, 2012
12.163
-0.776
-6.0%
jan 1, 2013
11.425
-0.738
-6.07%
jan 1, 2014
10.729
-0.696
-6.09%
jan 1, 2015
10.09
-0.639
-5.96%
jan 1, 2016
9.504
-0.586
-5.81%
Ranking of countries by current statistics by years


Comments: