29
/
en
AIzaSyAYiBZKx7MnpbEhh9jyipgxe19OcubqV5w
April 1, 2024
157924
Iran, Islamic Rep.
IRN
true
2
1
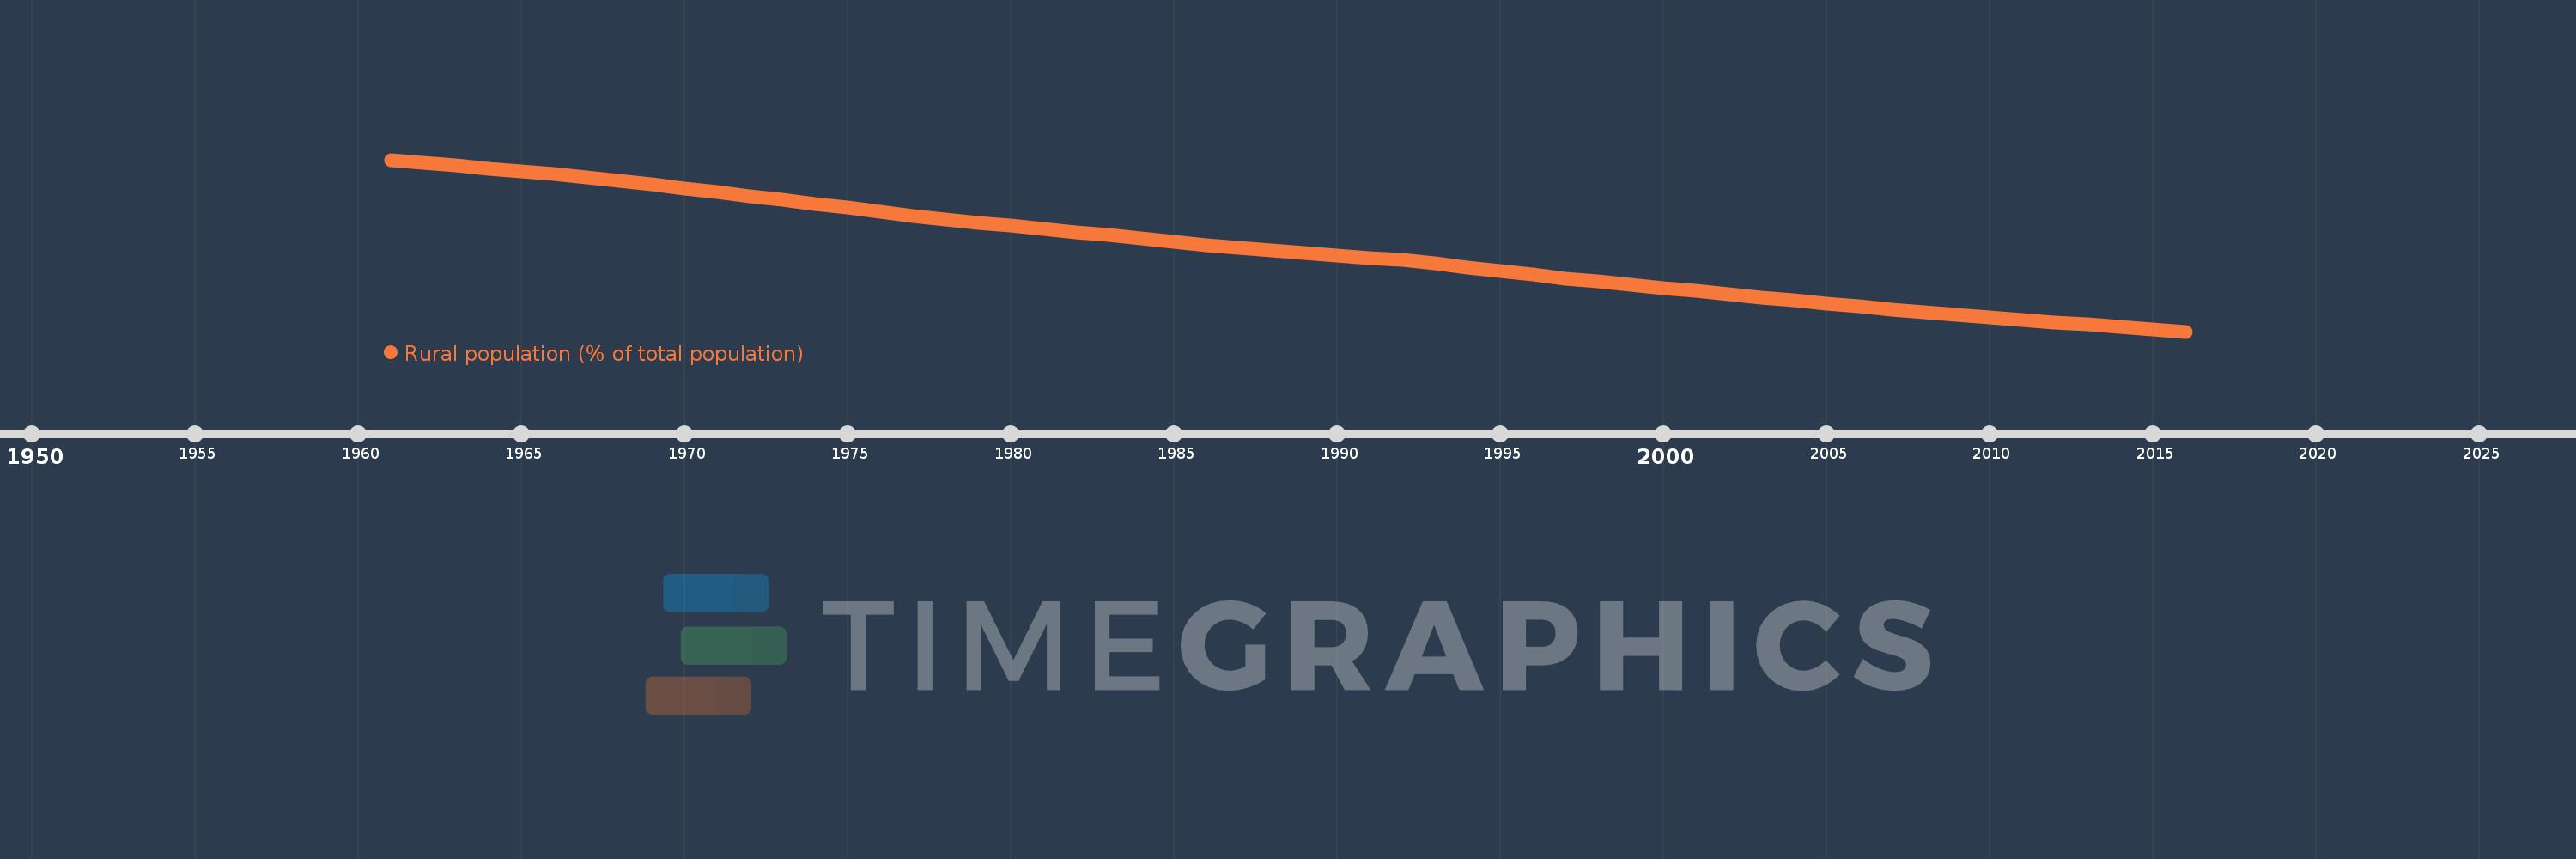
Rural population (% of total population)
2016,2015,2014,2013,2012,2011,2010,2009,2008,2007,2006,2005,2004,2003,2002,2001,2000,1999,1998,1997,1996,1995,1994,1993,1992,1991,1990,1989,1988,1987,1986,1985,1984,1983,1982,1981,1980,1979,1978,1977,1976,1975,1974,1973,1972,1971,1970,1969,1968,1967,1966,1965,1964,1963,1962,1961
This statistics in other country:
AfghanistanAlbaniaAlgeriaAmerican SamoaAndorraAngolaAntigua and BarbudaArab WorldArgentinaArmeniaArubaAustraliaAustriaAzerbaijanBahamas, TheBahrainBangladeshBarbadosBelarusBelgiumBelizeBeninBermudaBhutanBoliviaBosnia and HerzegovinaBotswanaBrazilBritish Virgin IslandsBrunei DarussalamBulgariaBurkina FasoBurundiCabo VerdeCambodiaCameroonCanadaCaribbean small statesCayman IslandsCentral African RepublicCentral Europe and the BalticsChadChannel IslandsChileChinaColombiaComorosCongo, Dem. Rep.Congo, Rep.Costa RicaCote d'IvoireCroatiaCubaCuracaoCyprusCzech RepublicDenmarkDjiboutiDominicaDominican RepublicEarly-demographic dividendEast Asia & PacificEast Asia & Pacific (excluding high income)East Asia & Pacific (IDA & IBRD countries)EcuadorEgypt, Arab Rep.El SalvadorEquatorial GuineaEritreaEstoniaEthiopiaEuro areaEurope & Central AsiaEurope & Central Asia (excluding high income)Europe & Central Asia (IDA & IBRD countries)European UnionFaroe IslandsFijiFinlandFragile and conflict affected situationsFranceFrench PolynesiaGabonGambia, TheGeorgiaGermanyGhanaGibraltarGreeceGreenlandGrenadaGuamGuatemalaGuineaGuinea-BissauGuyanaHaitiHeavily indebted poor countries (HIPC)High incomeHondurasHong Kong SAR, ChinaHungaryIBRD onlyIcelandIDA & IBRD totalIDA blendIDA onlyIDA totalIndiaIndonesiaIran, Islamic Rep.IraqIrelandIsle of ManIsraelItalyJamaicaJapanJordanKazakhstanKenyaKiribatiKorea, Dem. People’s Rep.Korea, Rep.KuwaitKyrgyz RepublicLao PDRLate-demographic dividendLatin America & Caribbean Latin America & Caribbean (excluding high income)Latin America & the Caribbean (IDA & IBRD countries)LatviaLeast developed countries: UN classificationLebanonLesothoLiberiaLibyaLiechtensteinLithuaniaLow & middle incomeLow incomeLower middle incomeLuxembourgMacao SAR, ChinaMacedonia, FYRMadagascarMalawiMalaysiaMaldivesMaliMaltaMarshall IslandsMauritaniaMauritiusMexicoMicronesia, Fed. Sts.Middle East & North AfricaMiddle East & North Africa (excluding high income)Middle East & North Africa (IDA & IBRD countries)Middle incomeMoldovaMonacoMongoliaMontenegroMoroccoMozambiqueMyanmarNamibiaNauruNepalNetherlandsNew CaledoniaNew ZealandNicaraguaNigerNigeriaNorth AmericaNorthern Mariana IslandsNorwayOECD membersOmanOther small statesPacific island small statesPakistanPalauPanamaPapua New GuineaParaguayPeruPhilippinesPolandPortugalPost-demographic dividendPre-demographic dividendPuerto RicoQatarRomaniaRussian FederationRwandaSamoaSan MarinoSao Tome and PrincipeSaudi ArabiaSenegalSerbiaSeychellesSierra LeoneSingaporeSint Maarten (Dutch part)Slovak RepublicSloveniaSmall statesSolomon IslandsSomaliaSouth AfricaSouth AsiaSouth Asia (IDA & IBRD)South SudanSpainSri LankaSt. Kitts and NevisSt. LuciaSt. Vincent and the GrenadinesSub-Saharan Africa Sub-Saharan Africa (excluding high income)Sub-Saharan Africa (IDA & IBRD countries)SudanSurinameSwazilandSwedenSwitzerlandSyrian Arab RepublicTajikistanTanzaniaThailandTimor-LesteTogoTongaTrinidad and TobagoTunisiaTurkeyTurkmenistanTurks and Caicos IslandsTuvaluUgandaUkraineUnited Arab EmiratesUnited KingdomUnited StatesUpper middle incomeUruguayUzbekistanVanuatuVenezuela, RBVietnamVirgin Islands (U.S.)West Bank and GazaWorldYemen, Rep.ZambiaZimbabwe Timeline:
This timeline shows a graph from 1961 to 2016 of Iran, Islamic Rep.. No data until 1960. Number of actual observations by date: 56.
Source name:
World Development Indicators
Source organization:
World Bank Staff estimates based on United Nations, World Urbanization Prospects.
Categories, topics:
Agriculture & Rural Development
Last updated:
apr 23, 2017
Indicators value changes by year
Minimum:
26.625
jan 1, 2016
Maximum:
66.265
jan 1, 1961
At the date of observation
Value
Absolute change
Change from previous value
jan 1, 1961
66.265
+66.265
0.0%
jan 1, 1962
65.611
-0.654
-0.99%
jan 1, 1963
64.949
-0.662
-1.01%
jan 1, 1964
64.282
-0.667
-1.03%
jan 1, 1965
63.609
-0.673
-1.05%
jan 1, 1966
62.932
-0.677
-1.06%
jan 1, 1967
62.248
-0.684
-1.09%
jan 1, 1968
61.443
-0.805
-1.29%
jan 1, 1969
60.563
-0.88
-1.43%
jan 1, 1970
59.679
-0.884
-1.46%
jan 1, 1971
58.788
-0.891
-1.49%
jan 1, 1972
57.89
-0.898
-1.53%
jan 1, 1973
56.986
-0.904
-1.56%
jan 1, 1974
56.08
-0.906
-1.59%
jan 1, 1975
55.168
-0.912
-1.63%
jan 1, 1976
54.253
-0.915
-1.66%
jan 1, 1977
53.334
-0.919
-1.69%
jan 1, 1978
52.53
-0.804
-1.51%
jan 1, 1979
51.79
-0.74
-1.41%
jan 1, 1980
51.049
-0.741
-1.43%
jan 1, 1981
50.307
-0.742
-1.45%
jan 1, 1982
49.566
-0.741
-1.47%
jan 1, 1983
48.825
-0.741
-1.49%
jan 1, 1984
48.084
-0.741
-1.52%
jan 1, 1985
47.343
-0.741
-1.54%
jan 1, 1986
46.605
-0.738
-1.56%
jan 1, 1987
45.867
-0.738
-1.58%
jan 1, 1988
45.283
-0.584
-1.27%
jan 1, 1989
44.743
-0.54
-1.19%
jan 1, 1990
44.206
-0.537
-1.2%
jan 1, 1991
43.67
-0.536
-1.21%
jan 1, 1992
43.135
-0.535
-1.23%
jan 1, 1993
42.347
-0.788
-1.83%
jan 1, 1994
41.481
-0.866
-2.05%
jan 1, 1995
40.62
-0.861
-2.08%
jan 1, 1996
39.764
-0.856
-2.11%
jan 1, 1997
38.913
-0.851
-2.14%
jan 1, 1998
38.147
-0.766
-1.97%
jan 1, 1999
37.412
-0.735
-1.93%
jan 1, 2000
36.682
-0.73
-1.95%
jan 1, 2001
35.958
-0.724
-1.97%
jan 1, 2002
35.242
-0.716
-1.99%
jan 1, 2003
34.532
-0.71
-2.01%
jan 1, 2004
33.828
-0.704
-2.04%
jan 1, 2005
33.131
-0.697
-2.06%
jan 1, 2006
32.442
-0.689
-2.08%
jan 1, 2007
31.761
-0.681
-2.1%
jan 1, 2008
31.136
-0.625
-1.97%
jan 1, 2009
30.542
-0.594
-1.91%
jan 1, 2010
29.955
-0.587
-1.92%
jan 1, 2011
29.374
-0.581
-1.94%
jan 1, 2012
28.8
-0.574
-1.95%
jan 1, 2013
28.231
-0.569
-1.98%
jan 1, 2014
27.68
-0.551
-1.95%
jan 1, 2015
27.145
-0.535
-1.93%
jan 1, 2016
26.625
-0.52
-1.92%
Ranking of countries by current statistics by years


Comments: