29
/
en
AIzaSyAYiBZKx7MnpbEhh9jyipgxe19OcubqV5w
April 1, 2024
204703
Myanmar
MMR
true
2
1
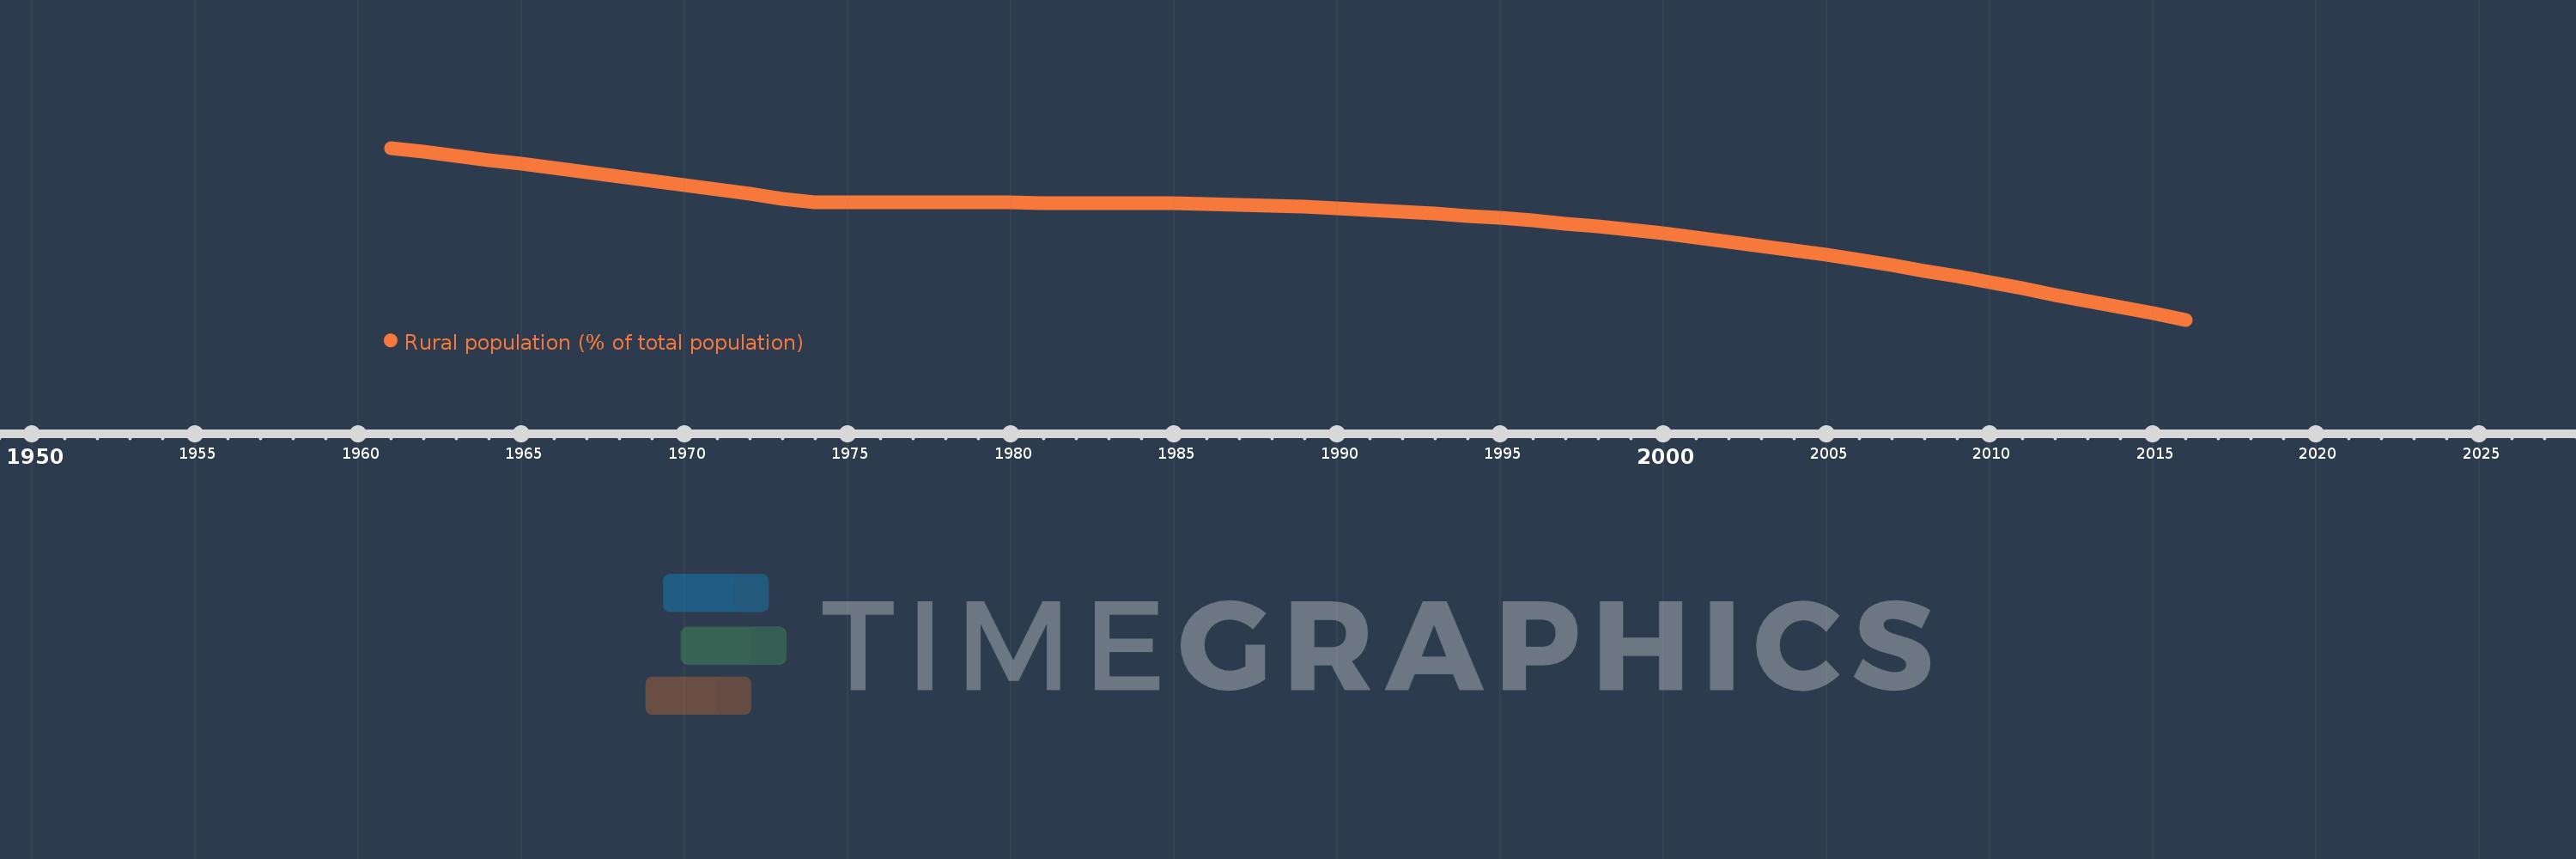
Rural population (% of total population)
2016,2015,2014,2013,2012,2011,2010,2009,2008,2007,2006,2005,2004,2003,2002,2001,2000,1999,1998,1997,1996,1995,1994,1993,1992,1991,1990,1989,1988,1987,1986,1985,1984,1983,1982,1981,1980,1979,1978,1977,1976,1975,1974,1973,1972,1971,1970,1969,1968,1967,1966,1965,1964,1963,1962,1961
This statistics in other country:
AfghanistanAlbaniaAlgeriaAmerican SamoaAndorraAngolaAntigua and BarbudaArab WorldArgentinaArmeniaArubaAustraliaAustriaAzerbaijanBahamas, TheBahrainBangladeshBarbadosBelarusBelgiumBelizeBeninBermudaBhutanBoliviaBosnia and HerzegovinaBotswanaBrazilBritish Virgin IslandsBrunei DarussalamBulgariaBurkina FasoBurundiCabo VerdeCambodiaCameroonCanadaCaribbean small statesCayman IslandsCentral African RepublicCentral Europe and the BalticsChadChannel IslandsChileChinaColombiaComorosCongo, Dem. Rep.Congo, Rep.Costa RicaCote d'IvoireCroatiaCubaCuracaoCyprusCzech RepublicDenmarkDjiboutiDominicaDominican RepublicEarly-demographic dividendEast Asia & PacificEast Asia & Pacific (excluding high income)East Asia & Pacific (IDA & IBRD countries)EcuadorEgypt, Arab Rep.El SalvadorEquatorial GuineaEritreaEstoniaEthiopiaEuro areaEurope & Central AsiaEurope & Central Asia (excluding high income)Europe & Central Asia (IDA & IBRD countries)European UnionFaroe IslandsFijiFinlandFragile and conflict affected situationsFranceFrench PolynesiaGabonGambia, TheGeorgiaGermanyGhanaGibraltarGreeceGreenlandGrenadaGuamGuatemalaGuineaGuinea-BissauGuyanaHaitiHeavily indebted poor countries (HIPC)High incomeHondurasHong Kong SAR, ChinaHungaryIBRD onlyIcelandIDA & IBRD totalIDA blendIDA onlyIDA totalIndiaIndonesiaIran, Islamic Rep.IraqIrelandIsle of ManIsraelItalyJamaicaJapanJordanKazakhstanKenyaKiribatiKorea, Dem. People’s Rep.Korea, Rep.KuwaitKyrgyz RepublicLao PDRLate-demographic dividendLatin America & Caribbean Latin America & Caribbean (excluding high income)Latin America & the Caribbean (IDA & IBRD countries)LatviaLeast developed countries: UN classificationLebanonLesothoLiberiaLibyaLiechtensteinLithuaniaLow & middle incomeLow incomeLower middle incomeLuxembourgMacao SAR, ChinaMacedonia, FYRMadagascarMalawiMalaysiaMaldivesMaliMaltaMarshall IslandsMauritaniaMauritiusMexicoMicronesia, Fed. Sts.Middle East & North AfricaMiddle East & North Africa (excluding high income)Middle East & North Africa (IDA & IBRD countries)Middle incomeMoldovaMonacoMongoliaMontenegroMoroccoMozambiqueMyanmarNamibiaNauruNepalNetherlandsNew CaledoniaNew ZealandNicaraguaNigerNigeriaNorth AmericaNorthern Mariana IslandsNorwayOECD membersOmanOther small statesPacific island small statesPakistanPalauPanamaPapua New GuineaParaguayPeruPhilippinesPolandPortugalPost-demographic dividendPre-demographic dividendPuerto RicoQatarRomaniaRussian FederationRwandaSamoaSan MarinoSao Tome and PrincipeSaudi ArabiaSenegalSerbiaSeychellesSierra LeoneSingaporeSint Maarten (Dutch part)Slovak RepublicSloveniaSmall statesSolomon IslandsSomaliaSouth AfricaSouth AsiaSouth Asia (IDA & IBRD)South SudanSpainSri LankaSt. Kitts and NevisSt. LuciaSt. Vincent and the GrenadinesSub-Saharan Africa Sub-Saharan Africa (excluding high income)Sub-Saharan Africa (IDA & IBRD countries)SudanSurinameSwazilandSwedenSwitzerlandSyrian Arab RepublicTajikistanTanzaniaThailandTimor-LesteTogoTongaTrinidad and TobagoTunisiaTurkeyTurkmenistanTurks and Caicos IslandsTuvaluUgandaUkraineUnited Arab EmiratesUnited KingdomUnited StatesUpper middle incomeUruguayUzbekistanVanuatuVenezuela, RBVietnamVirgin Islands (U.S.)West Bank and GazaWorldYemen, Rep.ZambiaZimbabwe Timeline:
This timeline shows a graph from 1961 to 2016 of Myanmar. No data until 1960. Number of actual observations by date: 56.
Source name:
World Development Indicators
Source organization:
World Bank Staff estimates based on United Nations, World Urbanization Prospects.
Categories, topics:
Agriculture & Rural Development
Last updated:
apr 23, 2017
Indicators value changes by year
Minimum:
65.902
jan 1, 2016
Maximum:
80.774
jan 1, 1961
At the date of observation
Value
Absolute change
Change from previous value
jan 1, 1961
80.774
+80.774
0.0%
jan 1, 1962
80.434
-0.34
-0.42%
jan 1, 1963
80.09
-0.344
-0.43%
jan 1, 1964
79.741
-0.349
-0.44%
jan 1, 1965
79.387
-0.354
-0.44%
jan 1, 1966
79.029
-0.358
-0.45%
jan 1, 1967
78.666
-0.363
-0.46%
jan 1, 1968
78.299
-0.367
-0.47%
jan 1, 1969
77.927
-0.372
-0.48%
jan 1, 1970
77.551
-0.376
-0.48%
jan 1, 1971
77.17
-0.381
-0.49%
jan 1, 1972
76.785
-0.385
-0.5%
jan 1, 1973
76.394
-0.391
-0.51%
jan 1, 1974
76.097
-0.297
-0.39%
jan 1, 1975
76.087
-0.01
-0.01%
jan 1, 1976
76.078
-0.009
-0.01%
jan 1, 1977
76.067
-0.011
-0.01%
jan 1, 1978
76.058
-0.009
-0.01%
jan 1, 1979
76.048
-0.01
-0.01%
jan 1, 1980
76.038
-0.01
-0.01%
jan 1, 1981
76.027
-0.011
-0.01%
jan 1, 1982
76.018
-0.009
-0.01%
jan 1, 1983
76.007
-0.011
-0.01%
jan 1, 1984
75.997
-0.01
-0.01%
jan 1, 1985
75.97
-0.027
-0.04%
jan 1, 1986
75.924
-0.046
-0.06%
jan 1, 1987
75.861
-0.063
-0.08%
jan 1, 1988
75.781
-0.08
-0.11%
jan 1, 1989
75.682
-0.099
-0.13%
jan 1, 1990
75.565
-0.117
-0.15%
jan 1, 1991
75.43
-0.135
-0.18%
jan 1, 1992
75.276
-0.154
-0.2%
jan 1, 1993
75.104
-0.172
-0.23%
jan 1, 1994
74.914
-0.19
-0.25%
jan 1, 1995
74.704
-0.21
-0.28%
jan 1, 1996
74.475
-0.229
-0.31%
jan 1, 1997
74.227
-0.248
-0.33%
jan 1, 1998
73.958
-0.269
-0.36%
jan 1, 1999
73.67
-0.288
-0.39%
jan 1, 2000
73.361
-0.309
-0.42%
jan 1, 2001
73.032
-0.329
-0.45%
jan 1, 2002
72.682
-0.35
-0.48%
jan 1, 2003
72.311
-0.371
-0.51%
jan 1, 2004
71.919
-0.392
-0.54%
jan 1, 2005
71.505
-0.414
-0.58%
jan 1, 2006
71.07
-0.435
-0.61%
jan 1, 2007
70.614
-0.456
-0.64%
jan 1, 2008
70.135
-0.479
-0.68%
jan 1, 2009
69.637
-0.498
-0.71%
jan 1, 2010
69.119
-0.518
-0.74%
jan 1, 2011
68.595
-0.524
-0.76%
jan 1, 2012
68.065
-0.53
-0.77%
jan 1, 2013
67.531
-0.534
-0.78%
jan 1, 2014
66.993
-0.538
-0.8%
jan 1, 2015
66.449
-0.544
-0.81%
jan 1, 2016
65.902
-0.547
-0.82%
Ranking of countries by current statistics by years


Comments: