29
/
en
AIzaSyAYiBZKx7MnpbEhh9jyipgxe19OcubqV5w
April 1, 2024
169506
Korea, Dem. People’s Rep.
PRK
true
2
1
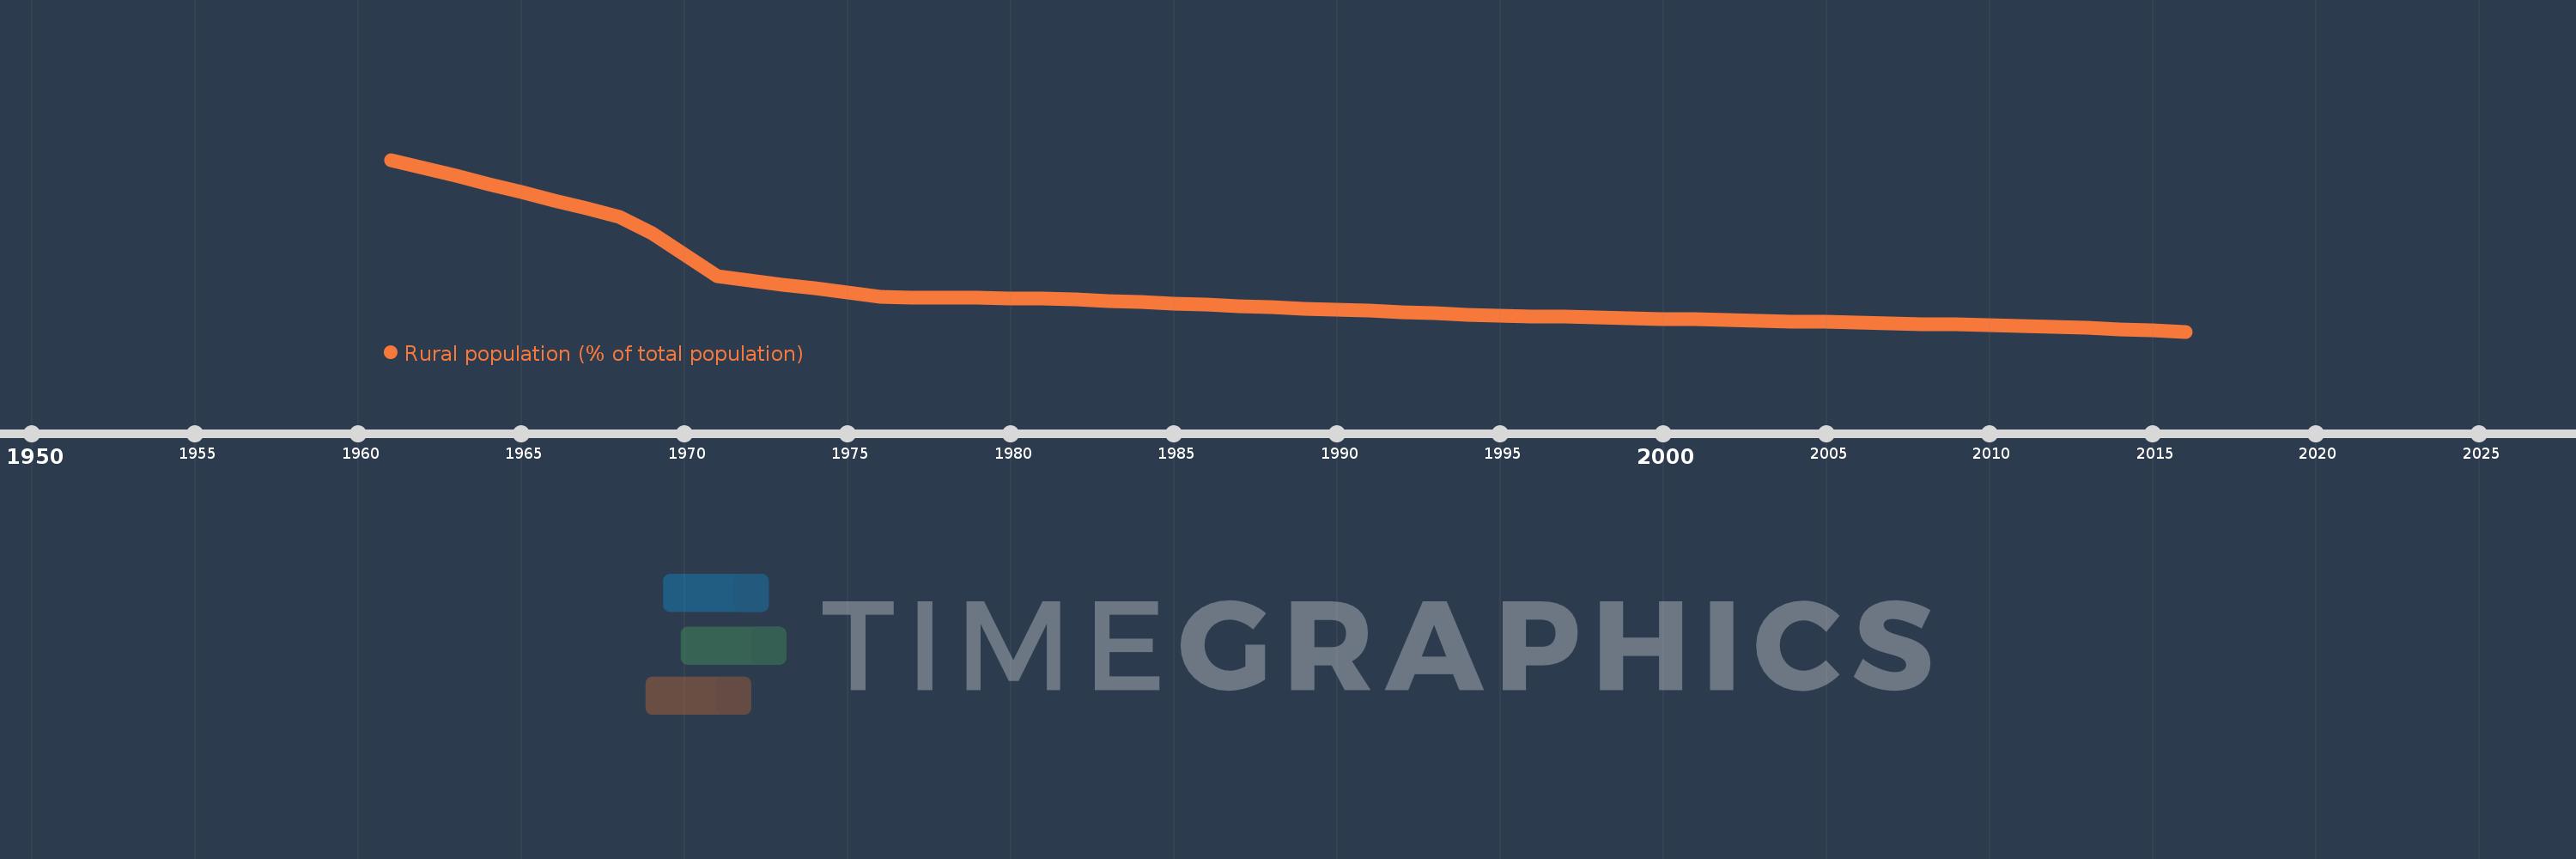
Rural population (% of total population)
2016,2015,2014,2013,2012,2011,2010,2009,2008,2007,2006,2005,2004,2003,2002,2001,2000,1999,1998,1997,1996,1995,1994,1993,1992,1991,1990,1989,1988,1987,1986,1985,1984,1983,1982,1981,1980,1979,1978,1977,1976,1975,1974,1973,1972,1971,1970,1969,1968,1967,1966,1965,1964,1963,1962,1961
This statistics in other country:
AfghanistanAlbaniaAlgeriaAmerican SamoaAndorraAngolaAntigua and BarbudaArab WorldArgentinaArmeniaArubaAustraliaAustriaAzerbaijanBahamas, TheBahrainBangladeshBarbadosBelarusBelgiumBelizeBeninBermudaBhutanBoliviaBosnia and HerzegovinaBotswanaBrazilBritish Virgin IslandsBrunei DarussalamBulgariaBurkina FasoBurundiCabo VerdeCambodiaCameroonCanadaCaribbean small statesCayman IslandsCentral African RepublicCentral Europe and the BalticsChadChannel IslandsChileChinaColombiaComorosCongo, Dem. Rep.Congo, Rep.Costa RicaCote d'IvoireCroatiaCubaCuracaoCyprusCzech RepublicDenmarkDjiboutiDominicaDominican RepublicEarly-demographic dividendEast Asia & PacificEast Asia & Pacific (excluding high income)East Asia & Pacific (IDA & IBRD countries)EcuadorEgypt, Arab Rep.El SalvadorEquatorial GuineaEritreaEstoniaEthiopiaEuro areaEurope & Central AsiaEurope & Central Asia (excluding high income)Europe & Central Asia (IDA & IBRD countries)European UnionFaroe IslandsFijiFinlandFragile and conflict affected situationsFranceFrench PolynesiaGabonGambia, TheGeorgiaGermanyGhanaGibraltarGreeceGreenlandGrenadaGuamGuatemalaGuineaGuinea-BissauGuyanaHaitiHeavily indebted poor countries (HIPC)High incomeHondurasHong Kong SAR, ChinaHungaryIBRD onlyIcelandIDA & IBRD totalIDA blendIDA onlyIDA totalIndiaIndonesiaIran, Islamic Rep.IraqIrelandIsle of ManIsraelItalyJamaicaJapanJordanKazakhstanKenyaKiribatiKorea, Dem. People’s Rep.Korea, Rep.KuwaitKyrgyz RepublicLao PDRLate-demographic dividendLatin America & Caribbean Latin America & Caribbean (excluding high income)Latin America & the Caribbean (IDA & IBRD countries)LatviaLeast developed countries: UN classificationLebanonLesothoLiberiaLibyaLiechtensteinLithuaniaLow & middle incomeLow incomeLower middle incomeLuxembourgMacao SAR, ChinaMacedonia, FYRMadagascarMalawiMalaysiaMaldivesMaliMaltaMarshall IslandsMauritaniaMauritiusMexicoMicronesia, Fed. Sts.Middle East & North AfricaMiddle East & North Africa (excluding high income)Middle East & North Africa (IDA & IBRD countries)Middle incomeMoldovaMonacoMongoliaMontenegroMoroccoMozambiqueMyanmarNamibiaNauruNepalNetherlandsNew CaledoniaNew ZealandNicaraguaNigerNigeriaNorth AmericaNorthern Mariana IslandsNorwayOECD membersOmanOther small statesPacific island small statesPakistanPalauPanamaPapua New GuineaParaguayPeruPhilippinesPolandPortugalPost-demographic dividendPre-demographic dividendPuerto RicoQatarRomaniaRussian FederationRwandaSamoaSan MarinoSao Tome and PrincipeSaudi ArabiaSenegalSerbiaSeychellesSierra LeoneSingaporeSint Maarten (Dutch part)Slovak RepublicSloveniaSmall statesSolomon IslandsSomaliaSouth AfricaSouth AsiaSouth Asia (IDA & IBRD)South SudanSpainSri LankaSt. Kitts and NevisSt. LuciaSt. Vincent and the GrenadinesSub-Saharan Africa Sub-Saharan Africa (excluding high income)Sub-Saharan Africa (IDA & IBRD countries)SudanSurinameSwazilandSwedenSwitzerlandSyrian Arab RepublicTajikistanTanzaniaThailandTimor-LesteTogoTongaTrinidad and TobagoTunisiaTurkeyTurkmenistanTurks and Caicos IslandsTuvaluUgandaUkraineUnited Arab EmiratesUnited KingdomUnited StatesUpper middle incomeUruguayUzbekistanVanuatuVenezuela, RBVietnamVirgin Islands (U.S.)West Bank and GazaWorldYemen, Rep.ZambiaZimbabwe Timeline:
This timeline shows a graph from 1961 to 2016 of Korea, Dem. People’s Rep.. No data until 1960. Number of actual observations by date: 56.
Source name:
World Development Indicators
Source organization:
World Bank Staff estimates based on United Nations, World Urbanization Prospects.
Categories, topics:
Agriculture & Rural Development
Last updated:
apr 23, 2017
Indicators value changes by year
Minimum:
39.125
jan 1, 2016
Maximum:
59.805
jan 1, 1961
At the date of observation
Value
Absolute change
Change from previous value
jan 1, 1961
59.805
+59.805
0.0%
jan 1, 1962
58.838
-0.967
-1.62%
jan 1, 1963
57.864
-0.974
-1.66%
jan 1, 1964
56.884
-0.98
-1.69%
jan 1, 1965
55.898
-0.986
-1.73%
jan 1, 1966
54.909
-0.989
-1.77%
jan 1, 1967
53.916
-0.993
-1.81%
jan 1, 1968
52.919
-0.997
-1.85%
jan 1, 1969
50.988
-1.931
-3.65%
jan 1, 1970
48.391
-2.597
-5.09%
jan 1, 1971
45.8
-2.591
-5.35%
jan 1, 1972
45.298
-0.502
-1.1%
jan 1, 1973
44.796
-0.502
-1.11%
jan 1, 1974
44.297
-0.499
-1.11%
jan 1, 1975
43.798
-0.499
-1.13%
jan 1, 1976
43.3
-0.498
-1.14%
jan 1, 1977
43.26
-0.04
-0.09%
jan 1, 1978
43.22
-0.04
-0.09%
jan 1, 1979
43.18
-0.04
-0.09%
jan 1, 1980
43.14
-0.04
-0.09%
jan 1, 1981
43.1
-0.04
-0.09%
jan 1, 1982
42.951
-0.149
-0.35%
jan 1, 1983
42.802
-0.149
-0.35%
jan 1, 1984
42.654
-0.148
-0.35%
jan 1, 1985
42.505
-0.149
-0.35%
jan 1, 1986
42.356
-0.149
-0.35%
jan 1, 1987
42.208
-0.148
-0.35%
jan 1, 1988
42.06
-0.148
-0.35%
jan 1, 1989
41.912
-0.148
-0.35%
jan 1, 1990
41.764
-0.148
-0.35%
jan 1, 1991
41.616
-0.148
-0.35%
jan 1, 1992
41.469
-0.147
-0.35%
jan 1, 1993
41.321
-0.148
-0.36%
jan 1, 1994
41.174
-0.147
-0.36%
jan 1, 1995
41.061
-0.113
-0.27%
jan 1, 1996
40.982
-0.079
-0.19%
jan 1, 1997
40.903
-0.079
-0.19%
jan 1, 1998
40.824
-0.079
-0.19%
jan 1, 1999
40.745
-0.079
-0.19%
jan 1, 2000
40.666
-0.079
-0.19%
jan 1, 2001
40.588
-0.078
-0.19%
jan 1, 2002
40.509
-0.079
-0.19%
jan 1, 2003
40.43
-0.079
-0.2%
jan 1, 2004
40.352
-0.078
-0.19%
jan 1, 2005
40.273
-0.079
-0.2%
jan 1, 2006
40.195
-0.078
-0.19%
jan 1, 2007
40.116
-0.079
-0.2%
jan 1, 2008
40.038
-0.078
-0.19%
jan 1, 2009
39.96
-0.078
-0.19%
jan 1, 2010
39.882
-0.078
-0.2%
jan 1, 2011
39.79
-0.092
-0.23%
jan 1, 2012
39.684
-0.106
-0.27%
jan 1, 2013
39.564
-0.12
-0.3%
jan 1, 2014
39.431
-0.133
-0.34%
jan 1, 2015
39.285
-0.146
-0.37%
jan 1, 2016
39.125
-0.16
-0.41%
Ranking of countries by current statistics by years


Comments: