29
/
en
AIzaSyAYiBZKx7MnpbEhh9jyipgxe19OcubqV5w
April 1, 2024
96272
Burundi
BDI
true
2
1
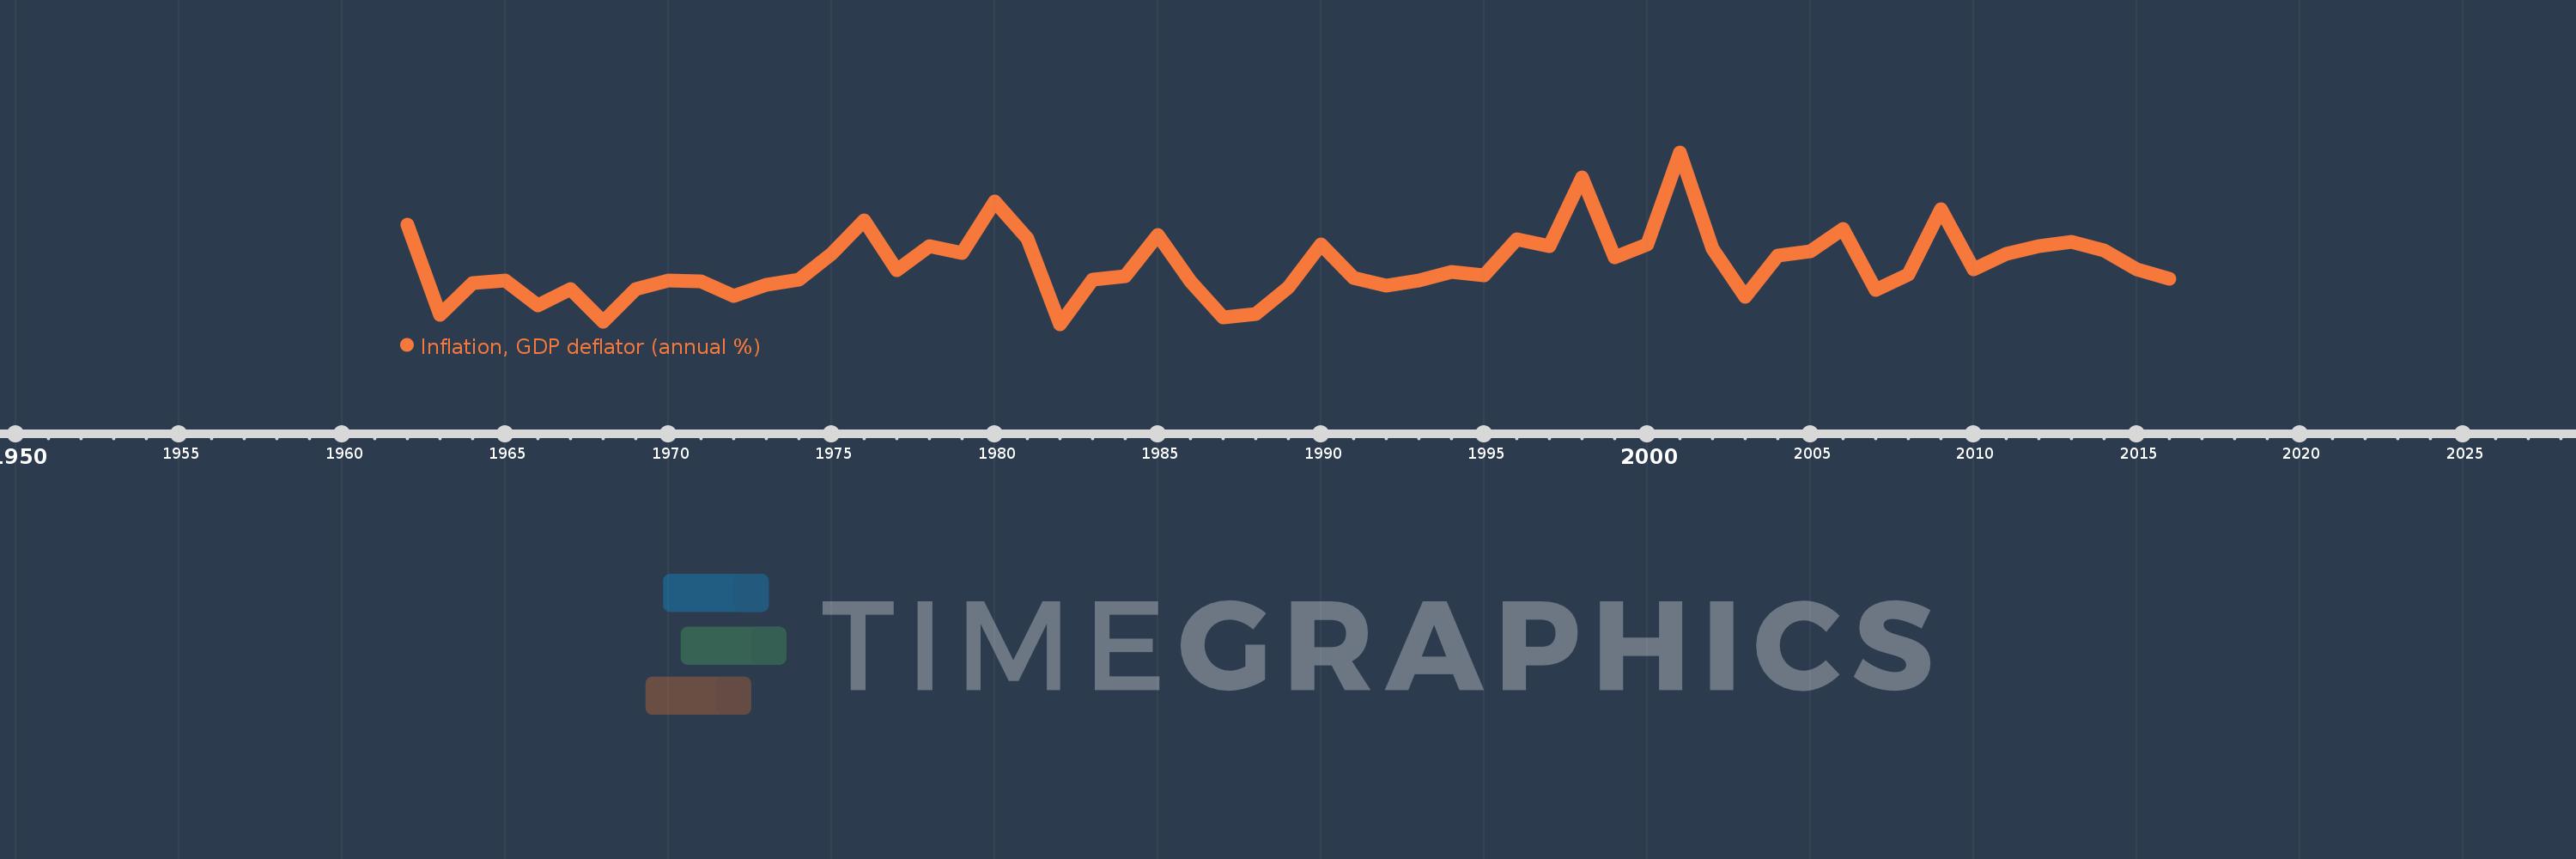
Inflation, GDP deflator (annual %)
2016,2015,2014,2013,2012,2011,2010,2009,2008,2007,2006,2005,2004,2003,2002,2001,2000,1999,1998,1997,1996,1995,1994,1993,1992,1991,1990,1989,1988,1987,1986,1985,1984,1983,1982,1981,1980,1979,1978,1977,1976,1975,1974,1973,1972,1971,1970,1969,1968,1967,1966,1965,1964,1963,1962
This statistics in other country:
AfghanistanAlbaniaAlgeriaAndorraAngolaAntigua and BarbudaArab WorldArgentinaArmeniaArubaAustraliaAustriaAzerbaijanBahamas, TheBahrainBangladeshBarbadosBelarusBelgiumBelizeBeninBermudaBhutanBoliviaBosnia and HerzegovinaBotswanaBrazilBrunei DarussalamBulgariaBurkina FasoBurundiCabo VerdeCambodiaCameroonCanadaCaribbean small statesCayman IslandsCentral African RepublicCentral Europe and the BalticsChadChannel IslandsChileChinaColombiaComorosCongo, Dem. Rep.Congo, Rep.Costa RicaCote d'IvoireCroatiaCubaCyprusCzech RepublicDenmarkDjiboutiDominicaDominican RepublicEarly-demographic dividendEast Asia & PacificEast Asia & Pacific (excluding high income)East Asia & Pacific (IDA & IBRD countries)EcuadorEgypt, Arab Rep.El SalvadorEquatorial GuineaEritreaEstoniaEthiopiaEuro areaEurope & Central AsiaEurope & Central Asia (excluding high income)Europe & Central Asia (IDA & IBRD countries)European UnionFijiFinlandFragile and conflict affected situationsFranceFrench PolynesiaGabonGambia, TheGeorgiaGermanyGhanaGreeceGreenlandGrenadaGuatemalaGuineaGuinea-BissauGuyanaHaitiHeavily indebted poor countries (HIPC)High incomeHondurasHong Kong SAR, ChinaHungaryIBRD onlyIcelandIDA & IBRD totalIDA blendIDA onlyIDA totalIndiaIndonesiaIran, Islamic Rep.IraqIrelandIsle of ManIsraelItalyJamaicaJapanJordanKazakhstanKenyaKiribatiKorea, Rep.KosovoKuwaitKyrgyz RepublicLao PDRLate-demographic dividendLatin America & Caribbean Latin America & Caribbean (excluding high income)Latin America & the Caribbean (IDA & IBRD countries)LatviaLeast developed countries: UN classificationLebanonLesothoLiberiaLibyaLiechtensteinLithuaniaLow & middle incomeLow incomeLower middle incomeLuxembourgMacao SAR, ChinaMacedonia, FYRMadagascarMalawiMalaysiaMaldivesMaliMaltaMarshall IslandsMauritaniaMauritiusMexicoMicronesia, Fed. Sts.Middle East & North AfricaMiddle East & North Africa (excluding high income)Middle East & North Africa (IDA & IBRD countries)Middle incomeMoldovaMonacoMongoliaMontenegroMoroccoMozambiqueMyanmarNamibiaNauruNepalNetherlandsNew CaledoniaNew ZealandNicaraguaNigerNigeriaNorth AmericaNorwayOECD membersOmanOther small statesPacific island small statesPakistanPalauPanamaPapua New GuineaParaguayPeruPhilippinesPolandPortugalPost-demographic dividendPre-demographic dividendPuerto RicoQatarRomaniaRussian FederationRwandaSamoaSan MarinoSao Tome and PrincipeSaudi ArabiaSenegalSerbiaSeychellesSierra LeoneSingaporeSlovak RepublicSloveniaSmall statesSolomon IslandsSomaliaSouth AfricaSouth AsiaSouth Asia (IDA & IBRD)South SudanSpainSri LankaSt. Kitts and NevisSt. LuciaSt. Vincent and the GrenadinesSub-Saharan Africa Sub-Saharan Africa (excluding high income)Sub-Saharan Africa (IDA & IBRD countries)SudanSurinameSwazilandSwedenSwitzerlandSyrian Arab RepublicTajikistanTanzaniaThailandTimor-LesteTogoTongaTrinidad and TobagoTunisiaTurkeyTurkmenistanTuvaluUgandaUkraineUnited Arab EmiratesUnited KingdomUnited StatesUpper middle incomeUruguayUzbekistanVanuatuVenezuela, RBVietnamVirgin Islands (U.S.)West Bank and GazaWorldYemen, Rep.ZambiaZimbabwe Timeline:
This timeline shows a graph from 1962 to 2016 of Burundi. No data until 1961. Number of actual observations by date: 55.
Source name:
World Development Indicators
Source organization:
World Bank national accounts data, and OECD National Accounts data files.
Categories, topics:
Economy & Growth
Last updated:
apr 23, 2017
Indicators value changes by year
Minimum:
-6.063
jan 1, 1982
Maximum:
38.945
jan 1, 2001
At the date of observation
Value
Absolute change
Change from previous value
jan 1, 1962
20.077
+20.077
0.0%
jan 1, 1963
-3.567
-23.645
-117.77%
jan 1, 1964
4.687
+8.255
-231.39%
jan 1, 1965
5.417
+0.73
15.58%
jan 1, 1966
-1.029
-6.447
-119.0%
jan 1, 1967
3.152
+4.181
-406.21%
jan 1, 1968
-5.318
-8.47
-268.72%
jan 1, 1969
3.057
+8.375
-157.48%
jan 1, 1970
5.362
+2.305
75.41%
jan 1, 1971
5.185
-0.177
-3.31%
jan 1, 1972
1.38
-3.804
-73.38%
jan 1, 1973
4.291
+2.911
210.88%
jan 1, 1974
5.51
+1.22
28.42%
jan 1, 1975
12.455
+6.945
126.03%
jan 1, 1976
21.087
+8.632
69.3%
jan 1, 1977
8.075
-13.012
-61.71%
jan 1, 1978
14.304
+6.229
77.14%
jan 1, 1979
12.508
-1.796
-12.56%
jan 1, 1980
26.131
+13.623
108.92%
jan 1, 1981
16.384
-9.747
-37.3%
jan 1, 1982
-6.063
-22.447
-137.01%
jan 1, 1983
5.672
+11.735
-193.55%
jan 1, 1984
6.429
+0.757
13.34%
jan 1, 1985
17.216
+10.788
167.81%
jan 1, 1986
5.069
-12.147
-70.56%
jan 1, 1987
-4.257
-9.326
-183.99%
jan 1, 1988
-3.418
+0.84
-19.72%
jan 1, 1989
3.491
+6.909
-202.15%
jan 1, 1990
14.757
+11.266
322.69%
jan 1, 1991
5.986
-8.772
-59.44%
jan 1, 1992
4.093
-1.892
-31.62%
jan 1, 1993
5.402
+1.309
31.97%
jan 1, 1994
7.743
+2.341
43.34%
jan 1, 1995
6.638
-1.104
-14.26%
jan 1, 1996
16.103
+9.464
142.57%
jan 1, 1997
14.453
-1.65
-10.24%
jan 1, 1998
32.398
+17.945
124.16%
jan 1, 1999
11.451
-20.947
-64.66%
jan 1, 2000
14.954
+3.504
30.6%
jan 1, 2001
38.945
+23.991
160.43%
jan 1, 2002
13.716
-25.228
-64.78%
jan 1, 2003
1.028
-12.689
-92.51%
jan 1, 2004
11.946
+10.918
1.06K%
jan 1, 2005
13.146
+1.2
10.05%
jan 1, 2006
18.857
+5.711
43.44%
jan 1, 2007
2.845
-16.012
-84.91%
jan 1, 2008
6.902
+4.057
142.59%
jan 1, 2009
23.991
+17.089
247.6%
jan 1, 2010
8.247
-15.744
-65.62%
jan 1, 2011
12.303
+4.056
49.18%
jan 1, 2012
14.294
+1.991
16.18%
jan 1, 2013
15.417
+1.122
7.85%
jan 1, 2014
13.163
-2.253
-14.61%
jan 1, 2015
8.303
-4.86
-36.92%
jan 1, 2016
5.887
-2.417
-29.1%
Ranking of countries by current statistics by years


Comments: