29
/
en
AIzaSyAYiBZKx7MnpbEhh9jyipgxe19OcubqV5w
April 1, 2024
78402
Bangladesh
BGD
true
2
1
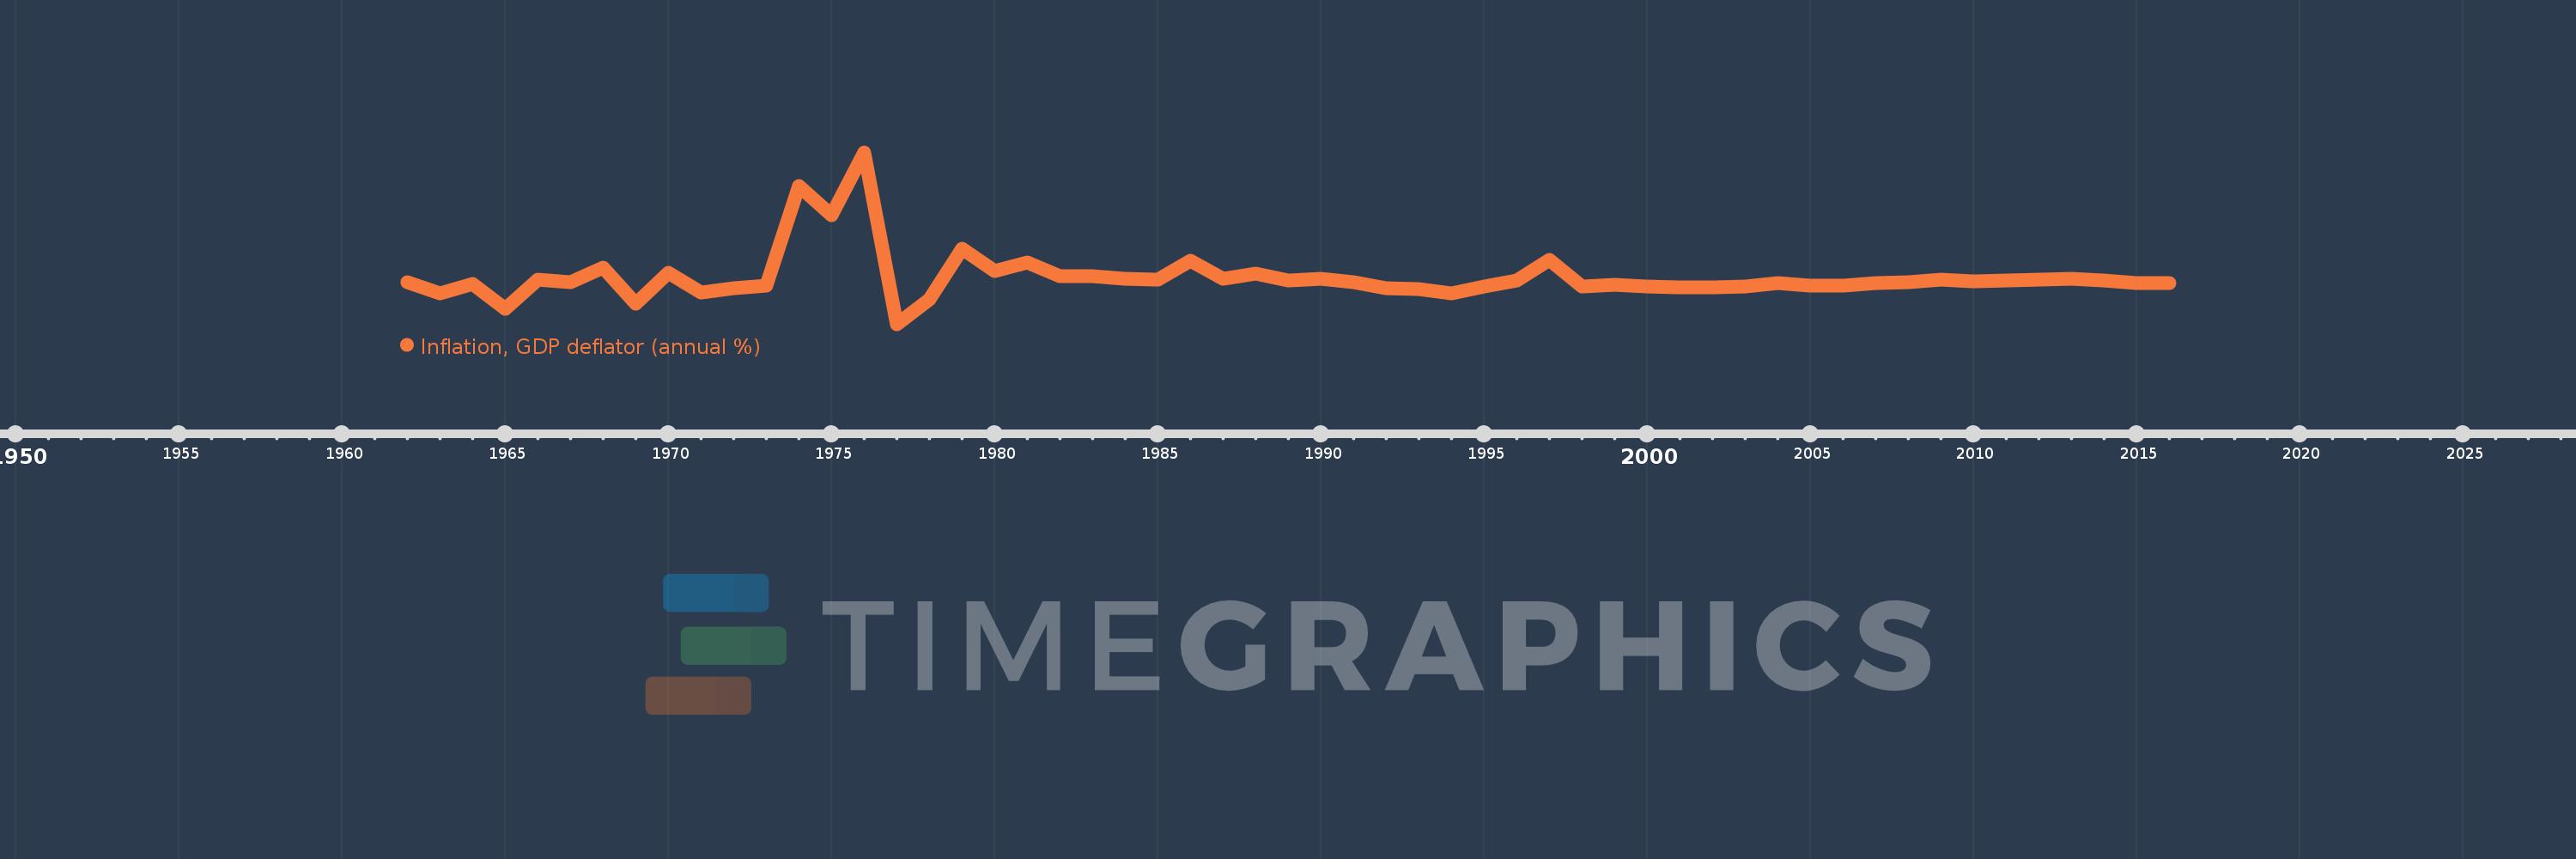
Inflation, GDP deflator (annual %)
2016,2015,2014,2013,2012,2011,2010,2009,2008,2007,2006,2005,2004,2003,2002,2001,2000,1999,1998,1997,1996,1995,1994,1993,1992,1991,1990,1989,1988,1987,1986,1985,1984,1983,1982,1981,1980,1979,1978,1977,1976,1975,1974,1973,1972,1971,1970,1969,1968,1967,1966,1965,1964,1963,1962
This statistics in other country:
AfghanistanAlbaniaAlgeriaAndorraAngolaAntigua and BarbudaArab WorldArgentinaArmeniaArubaAustraliaAustriaAzerbaijanBahamas, TheBahrainBangladeshBarbadosBelarusBelgiumBelizeBeninBermudaBhutanBoliviaBosnia and HerzegovinaBotswanaBrazilBrunei DarussalamBulgariaBurkina FasoBurundiCabo VerdeCambodiaCameroonCanadaCaribbean small statesCayman IslandsCentral African RepublicCentral Europe and the BalticsChadChannel IslandsChileChinaColombiaComorosCongo, Dem. Rep.Congo, Rep.Costa RicaCote d'IvoireCroatiaCubaCyprusCzech RepublicDenmarkDjiboutiDominicaDominican RepublicEarly-demographic dividendEast Asia & PacificEast Asia & Pacific (excluding high income)East Asia & Pacific (IDA & IBRD countries)EcuadorEgypt, Arab Rep.El SalvadorEquatorial GuineaEritreaEstoniaEthiopiaEuro areaEurope & Central AsiaEurope & Central Asia (excluding high income)Europe & Central Asia (IDA & IBRD countries)European UnionFijiFinlandFragile and conflict affected situationsFranceFrench PolynesiaGabonGambia, TheGeorgiaGermanyGhanaGreeceGreenlandGrenadaGuatemalaGuineaGuinea-BissauGuyanaHaitiHeavily indebted poor countries (HIPC)High incomeHondurasHong Kong SAR, ChinaHungaryIBRD onlyIcelandIDA & IBRD totalIDA blendIDA onlyIDA totalIndiaIndonesiaIran, Islamic Rep.IraqIrelandIsle of ManIsraelItalyJamaicaJapanJordanKazakhstanKenyaKiribatiKorea, Rep.KosovoKuwaitKyrgyz RepublicLao PDRLate-demographic dividendLatin America & Caribbean Latin America & Caribbean (excluding high income)Latin America & the Caribbean (IDA & IBRD countries)LatviaLeast developed countries: UN classificationLebanonLesothoLiberiaLibyaLiechtensteinLithuaniaLow & middle incomeLow incomeLower middle incomeLuxembourgMacao SAR, ChinaMacedonia, FYRMadagascarMalawiMalaysiaMaldivesMaliMaltaMarshall IslandsMauritaniaMauritiusMexicoMicronesia, Fed. Sts.Middle East & North AfricaMiddle East & North Africa (excluding high income)Middle East & North Africa (IDA & IBRD countries)Middle incomeMoldovaMonacoMongoliaMontenegroMoroccoMozambiqueMyanmarNamibiaNauruNepalNetherlandsNew CaledoniaNew ZealandNicaraguaNigerNigeriaNorth AmericaNorwayOECD membersOmanOther small statesPacific island small statesPakistanPalauPanamaPapua New GuineaParaguayPeruPhilippinesPolandPortugalPost-demographic dividendPre-demographic dividendPuerto RicoQatarRomaniaRussian FederationRwandaSamoaSan MarinoSao Tome and PrincipeSaudi ArabiaSenegalSerbiaSeychellesSierra LeoneSingaporeSlovak RepublicSloveniaSmall statesSolomon IslandsSomaliaSouth AfricaSouth AsiaSouth Asia (IDA & IBRD)South SudanSpainSri LankaSt. Kitts and NevisSt. LuciaSt. Vincent and the GrenadinesSub-Saharan Africa Sub-Saharan Africa (excluding high income)Sub-Saharan Africa (IDA & IBRD countries)SudanSurinameSwazilandSwedenSwitzerlandSyrian Arab RepublicTajikistanTanzaniaThailandTimor-LesteTogoTongaTrinidad and TobagoTunisiaTurkeyTurkmenistanTuvaluUgandaUkraineUnited Arab EmiratesUnited KingdomUnited StatesUpper middle incomeUruguayUzbekistanVanuatuVenezuela, RBVietnamVirgin Islands (U.S.)West Bank and GazaWorldYemen, Rep.ZambiaZimbabwe Timeline:
This timeline shows a graph from 1962 to 2016 of Bangladesh. No data until 1961. Number of actual observations by date: 55.
Source name:
World Development Indicators
Source organization:
World Bank national accounts data, and OECD National Accounts data files.
Categories, topics:
Economy & Growth
Last updated:
apr 23, 2017
Indicators value changes by year
Minimum:
-17.63
jan 1, 1977
At the date of observation
Value
Absolute change
Change from previous value
jan 1, 1962
6.257
+6.257
0.0%
jan 1, 1963
0.022
-6.235
-99.64%
jan 1, 1964
5.164
+5.142
23.14K%
jan 1, 1965
-8.743
-13.907
-269.31%
jan 1, 1966
7.932
+16.675
-190.72%
jan 1, 1967
6.296
-1.636
-20.62%
jan 1, 1968
14.792
+8.496
134.94%
jan 1, 1969
-5.77
-20.562
-139.0%
jan 1, 1970
11.828
+17.597
-305.0%
jan 1, 1971
0.51
-11.317
-95.69%
jan 1, 1972
2.963
+2.453
480.68%
jan 1, 1973
4.402
+1.439
48.55%
jan 1, 1974
61.406
+57.004
1.29K%
jan 1, 1975
44.543
-16.863
-27.46%
jan 1, 1976
80.57
+36.027
80.88%
jan 1, 1977
-17.63
-98.2
-121.88%
jan 1, 1978
-3.21
+14.42
-81.79%
jan 1, 1979
25.619
+28.829
-898.06%
jan 1, 1980
12.565
-13.054
-50.96%
jan 1, 1981
17.555
+4.991
39.72%
jan 1, 1982
9.895
-7.66
-43.64%
jan 1, 1983
9.856
-0.039
-0.39%
jan 1, 1984
8.488
-1.368
-13.88%
jan 1, 1985
7.876
-0.612
-7.21%
jan 1, 1986
18.495
+10.62
134.84%
jan 1, 1987
8.254
-10.241
-55.37%
jan 1, 1988
11.12
+2.865
34.71%
jan 1, 1989
7.496
-3.624
-32.59%
jan 1, 1990
8.338
+0.842
11.23%
jan 1, 1991
6.533
-1.805
-21.65%
jan 1, 1992
2.73
-3.803
-58.22%
jan 1, 1993
2.582
-0.147
-5.4%
jan 1, 1994
0.156
-2.427
-93.98%
jan 1, 1995
3.966
+3.811
2.45K%
jan 1, 1996
7.145
+3.179
80.14%
jan 1, 1997
19.143
+11.998
167.93%
jan 1, 1998
3.8
-15.343
-80.15%
jan 1, 1999
4.736
+0.936
24.63%
jan 1, 2000
3.781
-0.955
-20.17%
jan 1, 2001
3.447
-0.334
-8.84%
jan 1, 2002
3.261
-0.185
-5.38%
jan 1, 2003
3.893
+0.632
19.37%
jan 1, 2004
5.816
+1.923
49.4%
jan 1, 2005
4.562
-1.254
-21.56%
jan 1, 2006
4.586
+0.024
0.53%
jan 1, 2007
5.876
+1.29
28.12%
jan 1, 2008
6.471
+0.595
10.13%
jan 1, 2009
7.861
+1.39
21.48%
jan 1, 2010
6.764
-1.097
-13.95%
jan 1, 2011
7.145
+0.38
5.62%
jan 1, 2012
7.859
+0.715
10.0%
jan 1, 2013
8.165
+0.305
3.88%
jan 1, 2014
7.175
-0.99
-12.12%
jan 1, 2015
5.669
-1.506
-20.99%
jan 1, 2016
5.873
+0.204
3.6%
Ranking of countries by current statistics by years


Comments: