29
/
en
AIzaSyAYiBZKx7MnpbEhh9jyipgxe19OcubqV5w
April 1, 2024
160097
Isle of Man
IMN
true
2
1
Inflation, GDP deflator (annual %)
2015,2014,2013,2012,2011,2010,2009,2008,2007,2006,2005,2004,2003,2002,2001,2000,1999,1998,1997,1996,1995,1994,1993,1992,1991,1990,1989,1988,1987,1986
This statistics in other country:
AfghanistanAlbaniaAlgeriaAndorraAngolaAntigua and BarbudaArab WorldArgentinaArmeniaArubaAustraliaAustriaAzerbaijanBahamas, TheBahrainBangladeshBarbadosBelarusBelgiumBelizeBeninBermudaBhutanBoliviaBosnia and HerzegovinaBotswanaBrazilBrunei DarussalamBulgariaBurkina FasoBurundiCabo VerdeCambodiaCameroonCanadaCaribbean small statesCayman IslandsCentral African RepublicCentral Europe and the BalticsChadChannel IslandsChileChinaColombiaComorosCongo, Dem. Rep.Congo, Rep.Costa RicaCote d'IvoireCroatiaCubaCyprusCzech RepublicDenmarkDjiboutiDominicaDominican RepublicEarly-demographic dividendEast Asia & PacificEast Asia & Pacific (excluding high income)East Asia & Pacific (IDA & IBRD countries)EcuadorEgypt, Arab Rep.El SalvadorEquatorial GuineaEritreaEstoniaEthiopiaEuro areaEurope & Central AsiaEurope & Central Asia (excluding high income)Europe & Central Asia (IDA & IBRD countries)European UnionFijiFinlandFragile and conflict affected situationsFranceFrench PolynesiaGabonGambia, TheGeorgiaGermanyGhanaGreeceGreenlandGrenadaGuatemalaGuineaGuinea-BissauGuyanaHaitiHeavily indebted poor countries (HIPC)High incomeHondurasHong Kong SAR, ChinaHungaryIBRD onlyIcelandIDA & IBRD totalIDA blendIDA onlyIDA totalIndiaIndonesiaIran, Islamic Rep.IraqIrelandIsle of ManIsraelItalyJamaicaJapanJordanKazakhstanKenyaKiribatiKorea, Rep.KosovoKuwaitKyrgyz RepublicLao PDRLate-demographic dividendLatin America & Caribbean Latin America & Caribbean (excluding high income)Latin America & the Caribbean (IDA & IBRD countries)LatviaLeast developed countries: UN classificationLebanonLesothoLiberiaLibyaLiechtensteinLithuaniaLow & middle incomeLow incomeLower middle incomeLuxembourgMacao SAR, ChinaMacedonia, FYRMadagascarMalawiMalaysiaMaldivesMaliMaltaMarshall IslandsMauritaniaMauritiusMexicoMicronesia, Fed. Sts.Middle East & North AfricaMiddle East & North Africa (excluding high income)Middle East & North Africa (IDA & IBRD countries)Middle incomeMoldovaMonacoMongoliaMontenegroMoroccoMozambiqueMyanmarNamibiaNauruNepalNetherlandsNew CaledoniaNew ZealandNicaraguaNigerNigeriaNorth AmericaNorwayOECD membersOmanOther small statesPacific island small statesPakistanPalauPanamaPapua New GuineaParaguayPeruPhilippinesPolandPortugalPost-demographic dividendPre-demographic dividendPuerto RicoQatarRomaniaRussian FederationRwandaSamoaSan MarinoSao Tome and PrincipeSaudi ArabiaSenegalSerbiaSeychellesSierra LeoneSingaporeSlovak RepublicSloveniaSmall statesSolomon IslandsSomaliaSouth AfricaSouth AsiaSouth Asia (IDA & IBRD)South SudanSpainSri LankaSt. Kitts and NevisSt. LuciaSt. Vincent and the GrenadinesSub-Saharan Africa Sub-Saharan Africa (excluding high income)Sub-Saharan Africa (IDA & IBRD countries)SudanSurinameSwazilandSwedenSwitzerlandSyrian Arab RepublicTajikistanTanzaniaThailandTimor-LesteTogoTongaTrinidad and TobagoTunisiaTurkeyTurkmenistanTuvaluUgandaUkraineUnited Arab EmiratesUnited KingdomUnited StatesUpper middle incomeUruguayUzbekistanVanuatuVenezuela, RBVietnamVirgin Islands (U.S.)West Bank and GazaWorldYemen, Rep.ZambiaZimbabwe Timeline:
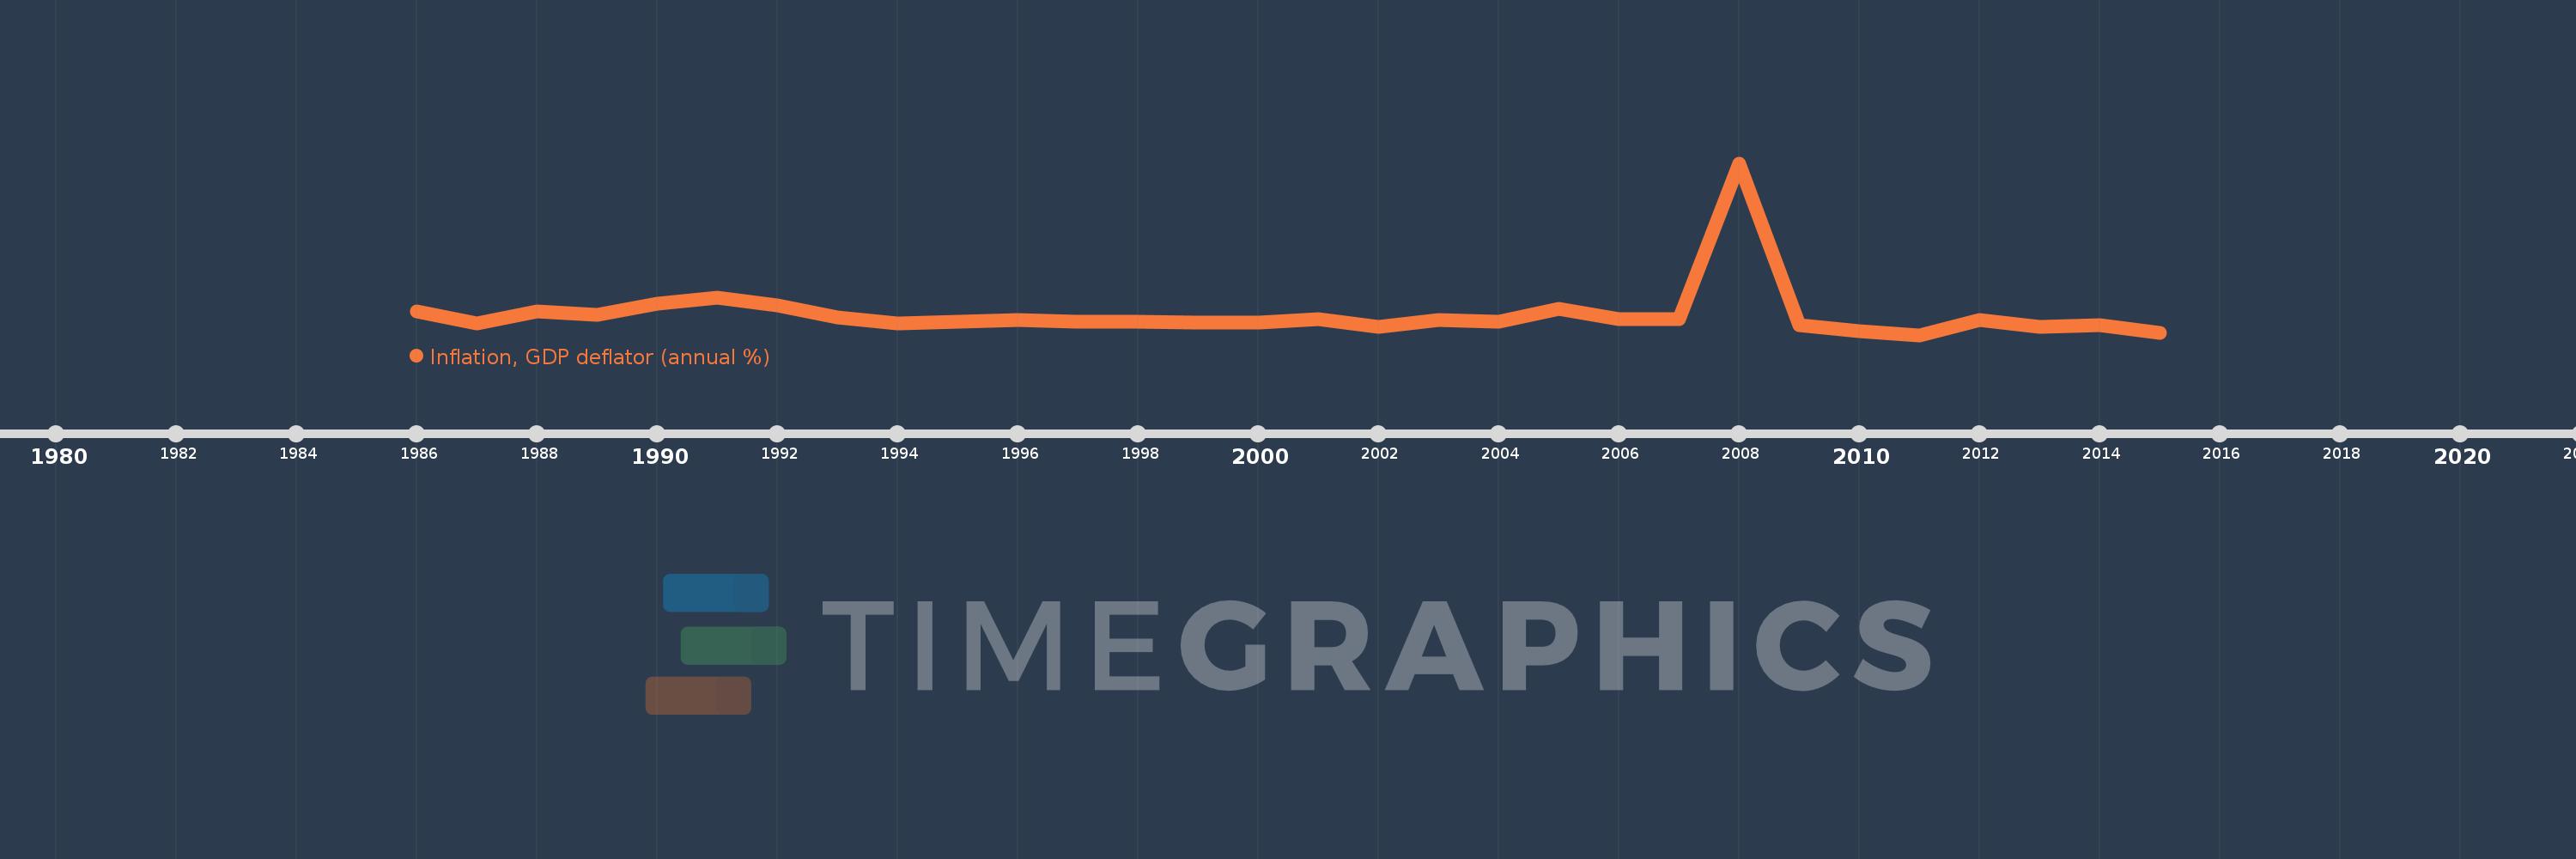
This timeline shows a graph from 1986 to 2015 of Isle of Man. No data until 1985. Number of actual observations by date: 30.
Source name:
World Development Indicators
Source organization:
World Bank national accounts data, and OECD National Accounts data files.
Categories, topics:
Economy & Growth
Last updated:
apr 23, 2017
Indicators value changes by year
Minimum:
-1.056
jan 1, 2011
Maximum:
45.499
jan 1, 2008
At the date of observation
Value
Absolute change
Change from previous value
jan 1, 1986
5.322
+5.322
0.0%
jan 1, 1987
2.172
-3.151
-59.2%
jan 1, 1988
5.371
+3.199
147.33%
jan 1, 1989
4.437
-0.934
-17.38%
jan 1, 1990
7.479
+3.042
68.55%
jan 1, 1991
9.049
+1.57
21.0%
jan 1, 1992
6.89
-2.159
-23.86%
jan 1, 1993
3.756
-3.135
-45.5%
jan 1, 1994
2.188
-1.568
-41.74%
jan 1, 1995
2.538
+0.35
15.99%
jan 1, 1996
2.939
+0.401
15.81%
jan 1, 1997
2.554
-0.384
-13.08%
jan 1, 1998
2.662
+0.107
4.2%
jan 1, 1999
2.379
-0.283
-10.63%
jan 1, 2000
2.3
-0.079
-3.31%
jan 1, 2001
3.267
+0.967
42.04%
jan 1, 2002
1.167
-2.1
-64.27%
jan 1, 2003
2.945
+1.778
152.29%
jan 1, 2004
2.65
-0.295
-10.02%
jan 1, 2005
5.963
+3.313
125.02%
jan 1, 2006
3.162
-2.801
-46.97%
jan 1, 2007
3.277
+0.115
3.63%
jan 1, 2008
45.499
+42.222
1.29K%
jan 1, 2009
1.55
-43.948
-96.59%
jan 1, 2010
0.083
-1.468
-94.67%
jan 1, 2011
-1.056
-1.139
-1.38K%
jan 1, 2012
2.972
+4.028
-381.36%
jan 1, 2013
1.234
-1.738
-58.49%
jan 1, 2014
1.538
+0.304
24.65%
jan 1, 2015
-0.528
-2.066
-134.33%
Ranking of countries by current statistics by years


Comments: