29
/
en
AIzaSyAYiBZKx7MnpbEhh9jyipgxe19OcubqV5w
April 1, 2024
39096
IDA only
IDX
false
2
1
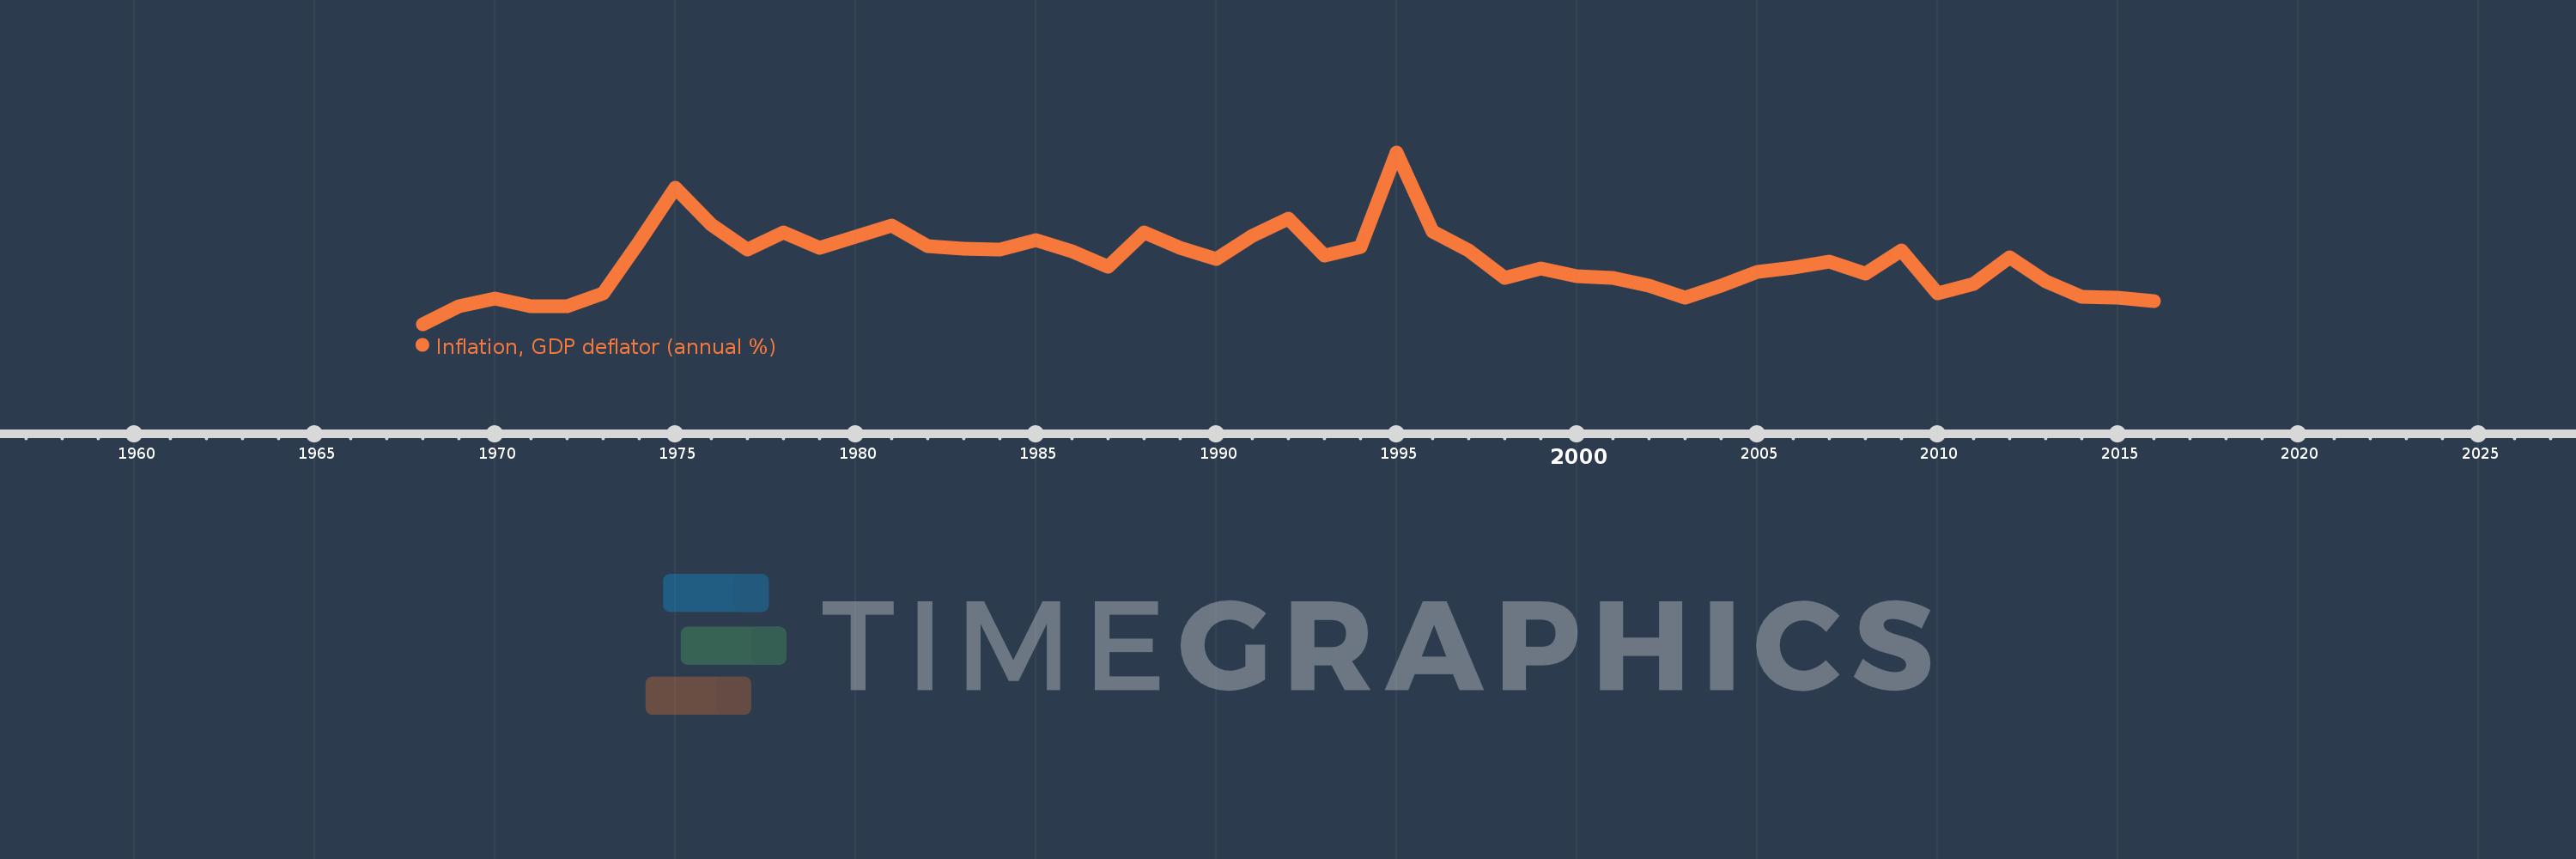
Inflation, GDP deflator (annual %)
2016,2015,2014,2013,2012,2011,2010,2009,2008,2007,2006,2005,2004,2003,2002,2001,2000,1999,1998,1997,1996,1995,1994,1993,1992,1991,1990,1989,1988,1987,1986,1985,1984,1983,1982,1981,1980,1979,1978,1977,1976,1975,1974,1973,1972,1971,1970,1969,1968
This statistics in other country:
AfghanistanAlbaniaAlgeriaAndorraAngolaAntigua and BarbudaArab WorldArgentinaArmeniaArubaAustraliaAustriaAzerbaijanBahamas, TheBahrainBangladeshBarbadosBelarusBelgiumBelizeBeninBermudaBhutanBoliviaBosnia and HerzegovinaBotswanaBrazilBrunei DarussalamBulgariaBurkina FasoBurundiCabo VerdeCambodiaCameroonCanadaCaribbean small statesCayman IslandsCentral African RepublicCentral Europe and the BalticsChadChannel IslandsChileChinaColombiaComorosCongo, Dem. Rep.Congo, Rep.Costa RicaCote d'IvoireCroatiaCubaCyprusCzech RepublicDenmarkDjiboutiDominicaDominican RepublicEarly-demographic dividendEast Asia & PacificEast Asia & Pacific (excluding high income)East Asia & Pacific (IDA & IBRD countries)EcuadorEgypt, Arab Rep.El SalvadorEquatorial GuineaEritreaEstoniaEthiopiaEuro areaEurope & Central AsiaEurope & Central Asia (excluding high income)Europe & Central Asia (IDA & IBRD countries)European UnionFijiFinlandFragile and conflict affected situationsFranceFrench PolynesiaGabonGambia, TheGeorgiaGermanyGhanaGreeceGreenlandGrenadaGuatemalaGuineaGuinea-BissauGuyanaHaitiHeavily indebted poor countries (HIPC)High incomeHondurasHong Kong SAR, ChinaHungaryIBRD onlyIcelandIDA & IBRD totalIDA blendIDA onlyIDA totalIndiaIndonesiaIran, Islamic Rep.IraqIrelandIsle of ManIsraelItalyJamaicaJapanJordanKazakhstanKenyaKiribatiKorea, Rep.KosovoKuwaitKyrgyz RepublicLao PDRLate-demographic dividendLatin America & Caribbean Latin America & Caribbean (excluding high income)Latin America & the Caribbean (IDA & IBRD countries)LatviaLeast developed countries: UN classificationLebanonLesothoLiberiaLibyaLiechtensteinLithuaniaLow & middle incomeLow incomeLower middle incomeLuxembourgMacao SAR, ChinaMacedonia, FYRMadagascarMalawiMalaysiaMaldivesMaliMaltaMarshall IslandsMauritaniaMauritiusMexicoMicronesia, Fed. Sts.Middle East & North AfricaMiddle East & North Africa (excluding high income)Middle East & North Africa (IDA & IBRD countries)Middle incomeMoldovaMonacoMongoliaMontenegroMoroccoMozambiqueMyanmarNamibiaNauruNepalNetherlandsNew CaledoniaNew ZealandNicaraguaNigerNigeriaNorth AmericaNorwayOECD membersOmanOther small statesPacific island small statesPakistanPalauPanamaPapua New GuineaParaguayPeruPhilippinesPolandPortugalPost-demographic dividendPre-demographic dividendPuerto RicoQatarRomaniaRussian FederationRwandaSamoaSan MarinoSao Tome and PrincipeSaudi ArabiaSenegalSerbiaSeychellesSierra LeoneSingaporeSlovak RepublicSloveniaSmall statesSolomon IslandsSomaliaSouth AfricaSouth AsiaSouth Asia (IDA & IBRD)South SudanSpainSri LankaSt. Kitts and NevisSt. LuciaSt. Vincent and the GrenadinesSub-Saharan Africa Sub-Saharan Africa (excluding high income)Sub-Saharan Africa (IDA & IBRD countries)SudanSurinameSwazilandSwedenSwitzerlandSyrian Arab RepublicTajikistanTanzaniaThailandTimor-LesteTogoTongaTrinidad and TobagoTunisiaTurkeyTurkmenistanTuvaluUgandaUkraineUnited Arab EmiratesUnited KingdomUnited StatesUpper middle incomeUruguayUzbekistanVanuatuVenezuela, RBVietnamVirgin Islands (U.S.)West Bank and GazaWorldYemen, Rep.ZambiaZimbabwe Timeline:
This timeline shows a graph from 1968 to 2016 of IDA only. No data until 1967. Number of actual observations by date: 49.
Source name:
World Development Indicators
Source organization:
World Bank national accounts data, and OECD National Accounts data files.
Categories, topics:
Economy & Growth
Last updated:
apr 23, 2017
Indicators value changes by year
At the date of observation
Value
Absolute change
Change from previous value
jan 1, 1968
1.083
+1.083
0.0%
jan 1, 1969
3.057
+1.974
182.32%
jan 1, 1970
3.864
+0.808
26.42%
jan 1, 1971
3.004
-0.86
-22.26%
jan 1, 1972
3.032
+0.027
0.91%
jan 1, 1973
4.402
+1.37
45.2%
jan 1, 1974
10.005
+5.603
127.28%
jan 1, 1975
15.907
+5.902
58.99%
jan 1, 1976
11.835
-4.072
-25.6%
jan 1, 1977
9.172
-2.663
-22.5%
jan 1, 1978
11.03
+1.858
20.26%
jan 1, 1979
9.371
-1.659
-15.04%
jan 1, 1980
10.597
+1.226
13.08%
jan 1, 1981
11.771
+1.174
11.08%
jan 1, 1982
9.502
-2.269
-19.27%
jan 1, 1983
9.284
-0.218
-2.3%
jan 1, 1984
9.16
-0.124
-1.33%
jan 1, 1985
10.225
+1.064
11.62%
jan 1, 1986
8.991
-1.233
-12.06%
jan 1, 1987
7.327
-1.665
-18.52%
jan 1, 1988
11.066
+3.739
51.04%
jan 1, 1989
9.362
-1.704
-15.4%
jan 1, 1990
8.157
-1.205
-12.87%
jan 1, 1991
10.649
+2.492
30.55%
jan 1, 1992
12.532
+1.883
17.68%
jan 1, 1993
8.566
-3.966
-31.65%
jan 1, 1994
9.481
+0.915
10.68%
jan 1, 1995
19.7
+10.219
107.79%
jan 1, 1996
11.084
-8.616
-43.73%
jan 1, 1997
9.075
-2.009
-18.13%
jan 1, 1998
6.106
-2.968
-32.71%
jan 1, 1999
7.092
+0.986
16.14%
jan 1, 2000
6.283
-0.809
-11.41%
jan 1, 2001
6.144
-0.139
-2.21%
jan 1, 2002
5.266
-0.878
-14.28%
jan 1, 2003
3.935
-1.332
-25.29%
jan 1, 2004
5.221
+1.287
32.7%
jan 1, 2005
6.734
+1.512
28.96%
jan 1, 2006
7.204
+0.47
6.98%
jan 1, 2007
7.847
+0.643
8.93%
jan 1, 2008
6.572
-1.276
-16.25%
jan 1, 2009
9.093
+2.521
38.36%
jan 1, 2010
4.443
-4.649
-51.13%
jan 1, 2011
5.462
+1.019
22.94%
jan 1, 2012
8.347
+2.884
52.8%
jan 1, 2013
5.747
-2.6
-31.14%
jan 1, 2014
4.032
-1.716
-29.85%
jan 1, 2015
3.979
-0.052
-1.3%
jan 1, 2016
3.617
-0.362
-9.09%
Ranking of countries by current statistics by years


Comments: