29
/
en
AIzaSyAYiBZKx7MnpbEhh9jyipgxe19OcubqV5w
April 1, 2024
240581
Singapore
SGP
true
2
1
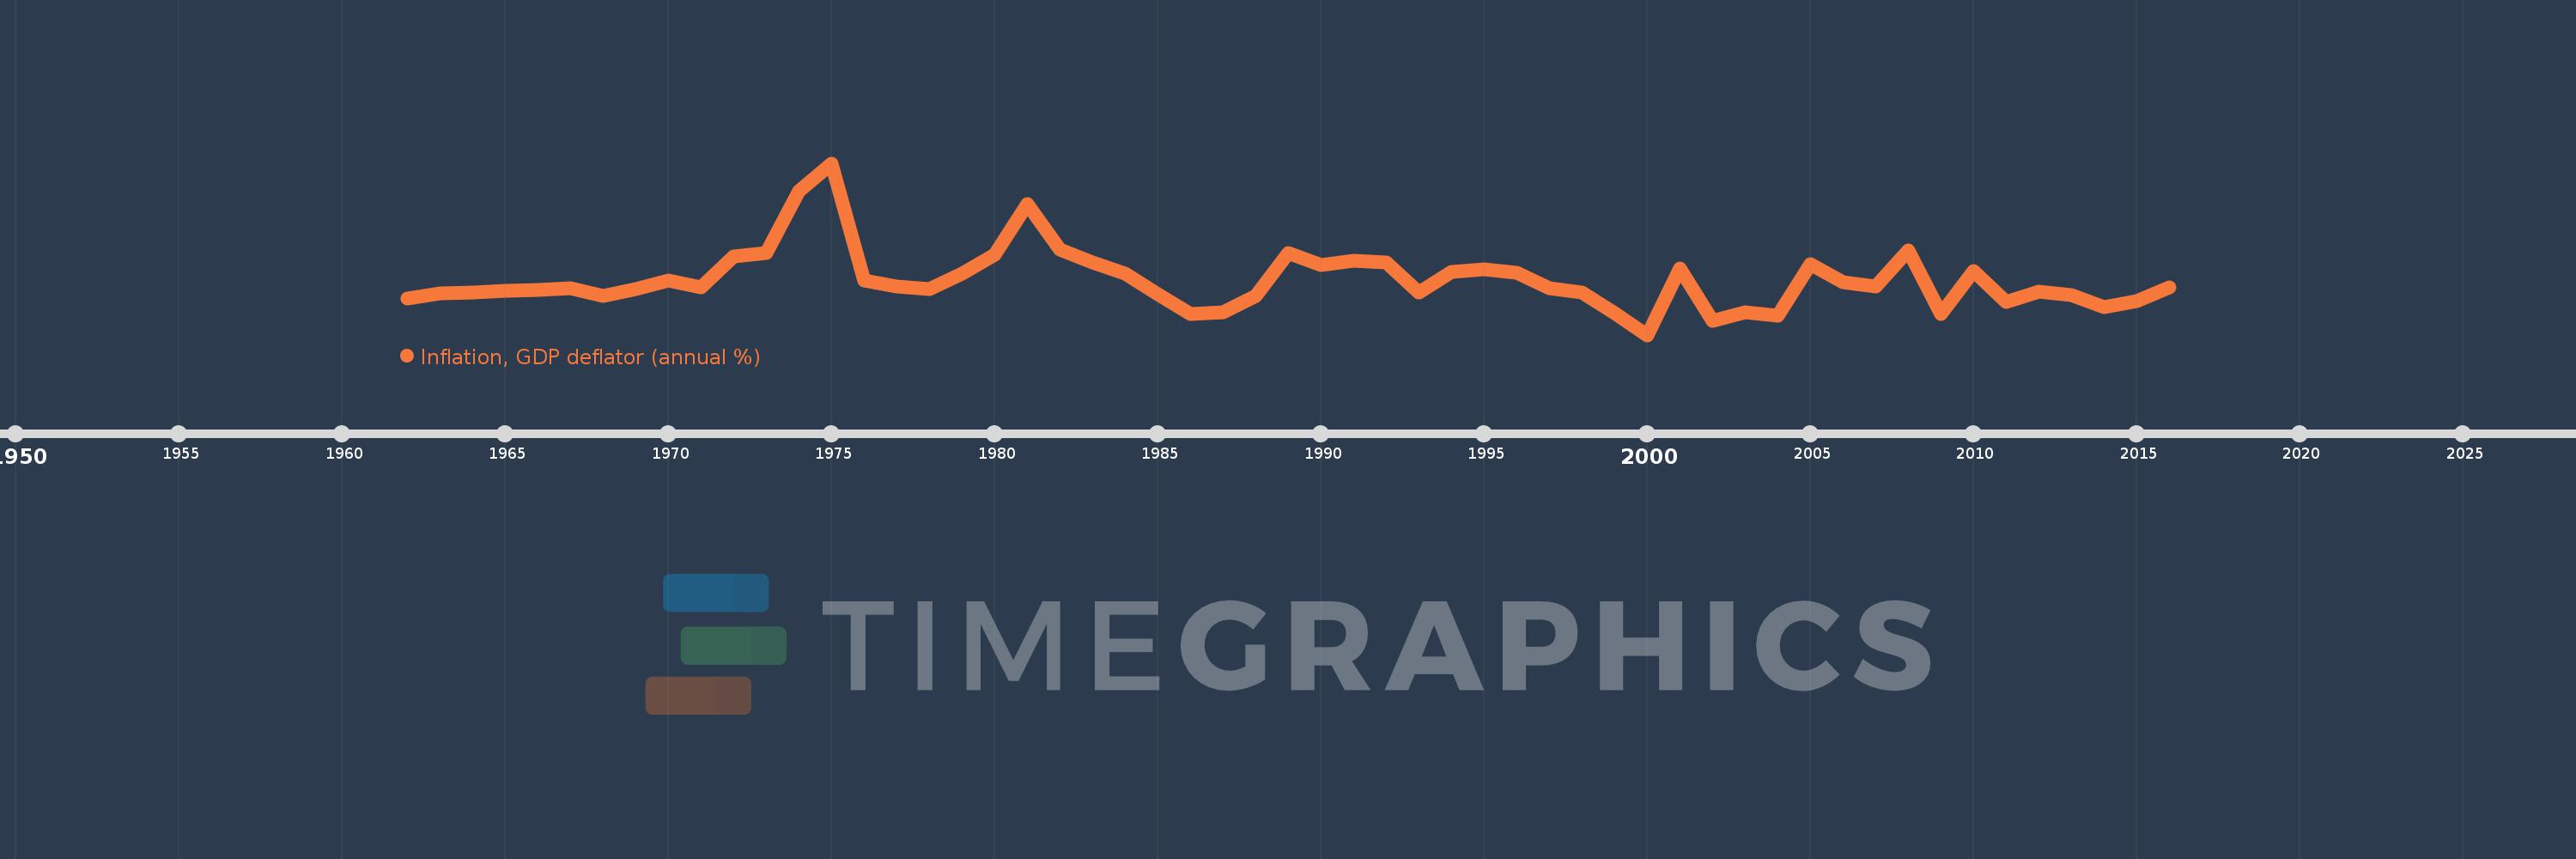
Inflation, GDP deflator (annual %)
2016,2015,2014,2013,2012,2011,2010,2009,2008,2007,2006,2005,2004,2003,2002,2001,2000,1999,1998,1997,1996,1995,1994,1993,1992,1991,1990,1989,1988,1987,1986,1985,1984,1983,1982,1981,1980,1979,1978,1977,1976,1975,1974,1973,1972,1971,1970,1969,1968,1967,1966,1965,1964,1963,1962
This statistics in other country:
AfghanistanAlbaniaAlgeriaAndorraAngolaAntigua and BarbudaArab WorldArgentinaArmeniaArubaAustraliaAustriaAzerbaijanBahamas, TheBahrainBangladeshBarbadosBelarusBelgiumBelizeBeninBermudaBhutanBoliviaBosnia and HerzegovinaBotswanaBrazilBrunei DarussalamBulgariaBurkina FasoBurundiCabo VerdeCambodiaCameroonCanadaCaribbean small statesCayman IslandsCentral African RepublicCentral Europe and the BalticsChadChannel IslandsChileChinaColombiaComorosCongo, Dem. Rep.Congo, Rep.Costa RicaCote d'IvoireCroatiaCubaCyprusCzech RepublicDenmarkDjiboutiDominicaDominican RepublicEarly-demographic dividendEast Asia & PacificEast Asia & Pacific (excluding high income)East Asia & Pacific (IDA & IBRD countries)EcuadorEgypt, Arab Rep.El SalvadorEquatorial GuineaEritreaEstoniaEthiopiaEuro areaEurope & Central AsiaEurope & Central Asia (excluding high income)Europe & Central Asia (IDA & IBRD countries)European UnionFijiFinlandFragile and conflict affected situationsFranceFrench PolynesiaGabonGambia, TheGeorgiaGermanyGhanaGreeceGreenlandGrenadaGuatemalaGuineaGuinea-BissauGuyanaHaitiHeavily indebted poor countries (HIPC)High incomeHondurasHong Kong SAR, ChinaHungaryIBRD onlyIcelandIDA & IBRD totalIDA blendIDA onlyIDA totalIndiaIndonesiaIran, Islamic Rep.IraqIrelandIsle of ManIsraelItalyJamaicaJapanJordanKazakhstanKenyaKiribatiKorea, Rep.KosovoKuwaitKyrgyz RepublicLao PDRLate-demographic dividendLatin America & Caribbean Latin America & Caribbean (excluding high income)Latin America & the Caribbean (IDA & IBRD countries)LatviaLeast developed countries: UN classificationLebanonLesothoLiberiaLibyaLiechtensteinLithuaniaLow & middle incomeLow incomeLower middle incomeLuxembourgMacao SAR, ChinaMacedonia, FYRMadagascarMalawiMalaysiaMaldivesMaliMaltaMarshall IslandsMauritaniaMauritiusMexicoMicronesia, Fed. Sts.Middle East & North AfricaMiddle East & North Africa (excluding high income)Middle East & North Africa (IDA & IBRD countries)Middle incomeMoldovaMonacoMongoliaMontenegroMoroccoMozambiqueMyanmarNamibiaNauruNepalNetherlandsNew CaledoniaNew ZealandNicaraguaNigerNigeriaNorth AmericaNorwayOECD membersOmanOther small statesPacific island small statesPakistanPalauPanamaPapua New GuineaParaguayPeruPhilippinesPolandPortugalPost-demographic dividendPre-demographic dividendPuerto RicoQatarRomaniaRussian FederationRwandaSamoaSan MarinoSao Tome and PrincipeSaudi ArabiaSenegalSerbiaSeychellesSierra LeoneSingaporeSlovak RepublicSloveniaSmall statesSolomon IslandsSomaliaSouth AfricaSouth AsiaSouth Asia (IDA & IBRD)South SudanSpainSri LankaSt. Kitts and NevisSt. LuciaSt. Vincent and the GrenadinesSub-Saharan Africa Sub-Saharan Africa (excluding high income)Sub-Saharan Africa (IDA & IBRD countries)SudanSurinameSwazilandSwedenSwitzerlandSyrian Arab RepublicTajikistanTanzaniaThailandTimor-LesteTogoTongaTrinidad and TobagoTunisiaTurkeyTurkmenistanTuvaluUgandaUkraineUnited Arab EmiratesUnited KingdomUnited StatesUpper middle incomeUruguayUzbekistanVanuatuVenezuela, RBVietnamVirgin Islands (U.S.)West Bank and GazaWorldYemen, Rep.ZambiaZimbabwe Timeline:
This timeline shows a graph from 1962 to 2016 of Singapore. No data until 1961. Number of actual observations by date: 55.
Source name:
World Development Indicators
Source organization:
World Bank national accounts data, and OECD National Accounts data files.
Categories, topics:
Economy & Growth
Last updated:
apr 23, 2017
Indicators value changes by year
Minimum:
-3.899
jan 1, 2000
Maximum:
15.904
jan 1, 1975
At the date of observation
Value
Absolute change
Change from previous value
jan 1, 1962
0.331
+0.331
0.0%
jan 1, 1963
0.873
+0.542
163.88%
jan 1, 1964
0.977
+0.104
11.93%
jan 1, 1965
1.163
+0.186
19.01%
jan 1, 1966
1.306
+0.144
12.35%
jan 1, 1967
1.463
+0.157
12.03%
jan 1, 1968
0.56
-0.903
-61.7%
jan 1, 1969
1.358
+0.798
142.3%
jan 1, 1970
2.372
+1.014
74.69%
jan 1, 1971
1.592
-0.78
-32.88%
jan 1, 1972
5.166
+3.574
224.44%
jan 1, 1973
5.528
+0.362
7.01%
jan 1, 1974
12.664
+7.136
129.11%
jan 1, 1975
15.904
+3.24
25.58%
jan 1, 1976
2.367
-13.537
-85.12%
jan 1, 1977
1.715
-0.652
-27.54%
jan 1, 1978
1.399
-0.316
-18.42%
jan 1, 1979
3.153
+1.754
125.36%
jan 1, 1980
5.358
+2.205
69.92%
jan 1, 1981
11.215
+5.857
109.31%
jan 1, 1982
6.002
-5.214
-46.49%
jan 1, 1983
4.454
-1.547
-25.78%
jan 1, 1984
3.168
-1.286
-28.88%
jan 1, 1985
0.762
-2.406
-75.96%
jan 1, 1986
-1.428
-2.19
-287.53%
jan 1, 1987
-1.237
+0.192
-13.42%
jan 1, 1988
0.56
+1.797
-145.31%
jan 1, 1989
5.538
+4.978
888.31%
jan 1, 1990
4.134
-1.404
-25.36%
jan 1, 1991
4.651
+0.517
12.5%
jan 1, 1992
4.433
-0.217
-4.67%
jan 1, 1993
0.996
-3.437
-77.53%
jan 1, 1994
3.402
+2.406
241.6%
jan 1, 1995
3.673
+0.271
7.97%
jan 1, 1996
3.289
-0.384
-10.45%
jan 1, 1997
1.471
-1.818
-55.27%
jan 1, 1998
1.035
-0.436
-29.63%
jan 1, 1999
-1.357
-2.393
-231.09%
jan 1, 2000
-3.899
-2.541
187.24%
jan 1, 2001
3.739
+7.638
-195.91%
jan 1, 2002
-2.243
-5.982
-159.98%
jan 1, 2003
-1.249
+0.994
-44.32%
jan 1, 2004
-1.708
-0.459
36.75%
jan 1, 2005
4.25
+5.958
-348.88%
jan 1, 2006
2.226
-2.024
-47.62%
jan 1, 2007
1.72
-0.506
-22.74%
jan 1, 2008
5.861
+4.141
240.76%
jan 1, 2009
-1.492
-7.353
-125.45%
jan 1, 2010
3.521
+5.013
-336.05%
jan 1, 2011
-0.046
-3.567
-101.31%
jan 1, 2012
1.11
+1.156
-2.51K%
jan 1, 2013
0.73
-0.38
-34.23%
jan 1, 2014
-0.7
-1.431
-195.88%
jan 1, 2015
0.043
+0.744
-106.2%
jan 1, 2016
1.64
+1.596
3.68K%
Ranking of countries by current statistics by years


Comments: