29
/
en
AIzaSyAYiBZKx7MnpbEhh9jyipgxe19OcubqV5w
April 1, 2024
109824
Congo, Dem. Rep.
COD
true
2
1
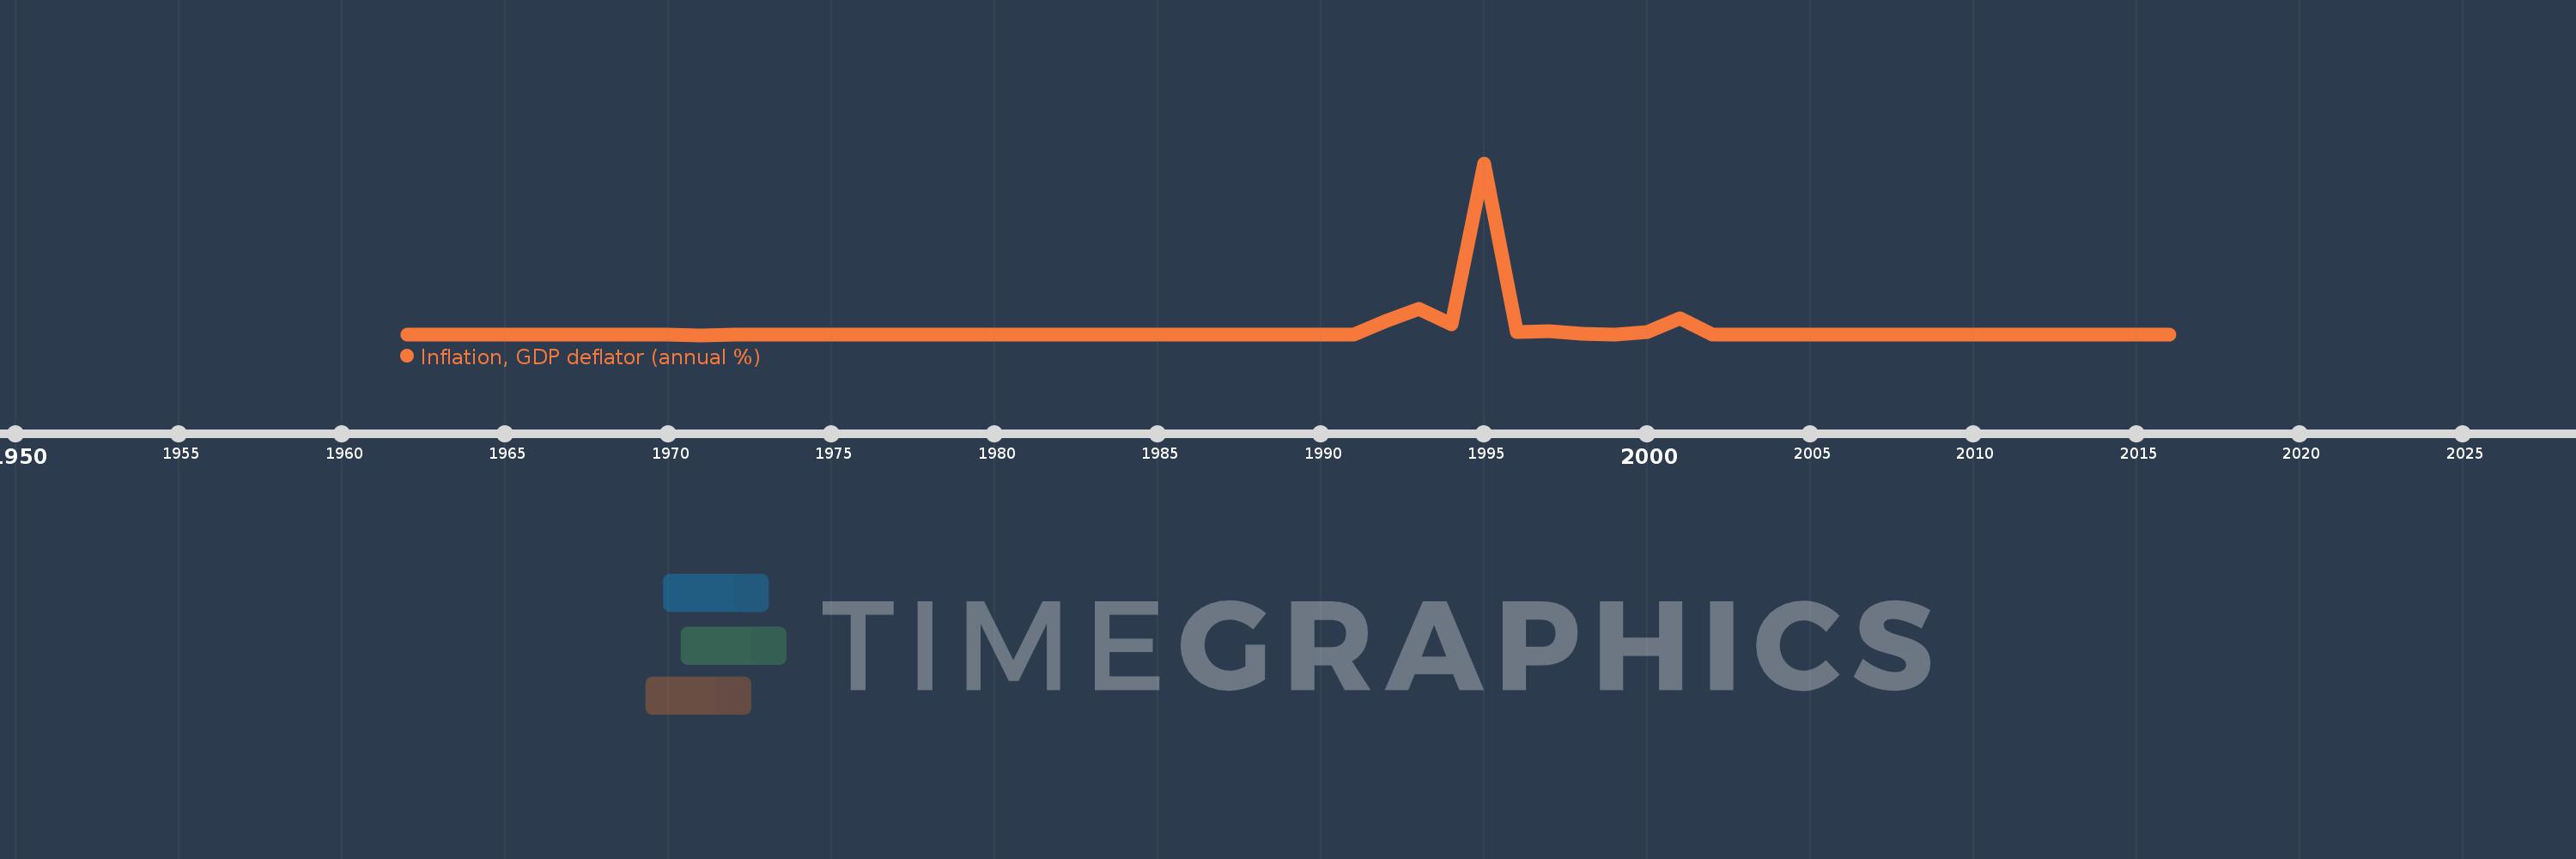
Inflation, GDP deflator (annual %)
2016,2015,2014,2013,2012,2011,2010,2009,2008,2007,2006,2005,2004,2003,2002,2001,2000,1999,1998,1997,1996,1995,1994,1993,1992,1991,1990,1989,1988,1987,1986,1985,1984,1983,1982,1981,1980,1979,1978,1977,1976,1975,1974,1973,1972,1971,1970,1969,1968,1967,1966,1965,1964,1963,1962
This statistics in other country:
AfghanistanAlbaniaAlgeriaAndorraAngolaAntigua and BarbudaArab WorldArgentinaArmeniaArubaAustraliaAustriaAzerbaijanBahamas, TheBahrainBangladeshBarbadosBelarusBelgiumBelizeBeninBermudaBhutanBoliviaBosnia and HerzegovinaBotswanaBrazilBrunei DarussalamBulgariaBurkina FasoBurundiCabo VerdeCambodiaCameroonCanadaCaribbean small statesCayman IslandsCentral African RepublicCentral Europe and the BalticsChadChannel IslandsChileChinaColombiaComorosCongo, Dem. Rep.Congo, Rep.Costa RicaCote d'IvoireCroatiaCubaCyprusCzech RepublicDenmarkDjiboutiDominicaDominican RepublicEarly-demographic dividendEast Asia & PacificEast Asia & Pacific (excluding high income)East Asia & Pacific (IDA & IBRD countries)EcuadorEgypt, Arab Rep.El SalvadorEquatorial GuineaEritreaEstoniaEthiopiaEuro areaEurope & Central AsiaEurope & Central Asia (excluding high income)Europe & Central Asia (IDA & IBRD countries)European UnionFijiFinlandFragile and conflict affected situationsFranceFrench PolynesiaGabonGambia, TheGeorgiaGermanyGhanaGreeceGreenlandGrenadaGuatemalaGuineaGuinea-BissauGuyanaHaitiHeavily indebted poor countries (HIPC)High incomeHondurasHong Kong SAR, ChinaHungaryIBRD onlyIcelandIDA & IBRD totalIDA blendIDA onlyIDA totalIndiaIndonesiaIran, Islamic Rep.IraqIrelandIsle of ManIsraelItalyJamaicaJapanJordanKazakhstanKenyaKiribatiKorea, Rep.KosovoKuwaitKyrgyz RepublicLao PDRLate-demographic dividendLatin America & Caribbean Latin America & Caribbean (excluding high income)Latin America & the Caribbean (IDA & IBRD countries)LatviaLeast developed countries: UN classificationLebanonLesothoLiberiaLibyaLiechtensteinLithuaniaLow & middle incomeLow incomeLower middle incomeLuxembourgMacao SAR, ChinaMacedonia, FYRMadagascarMalawiMalaysiaMaldivesMaliMaltaMarshall IslandsMauritaniaMauritiusMexicoMicronesia, Fed. Sts.Middle East & North AfricaMiddle East & North Africa (excluding high income)Middle East & North Africa (IDA & IBRD countries)Middle incomeMoldovaMonacoMongoliaMontenegroMoroccoMozambiqueMyanmarNamibiaNauruNepalNetherlandsNew CaledoniaNew ZealandNicaraguaNigerNigeriaNorth AmericaNorwayOECD membersOmanOther small statesPacific island small statesPakistanPalauPanamaPapua New GuineaParaguayPeruPhilippinesPolandPortugalPost-demographic dividendPre-demographic dividendPuerto RicoQatarRomaniaRussian FederationRwandaSamoaSan MarinoSao Tome and PrincipeSaudi ArabiaSenegalSerbiaSeychellesSierra LeoneSingaporeSlovak RepublicSloveniaSmall statesSolomon IslandsSomaliaSouth AfricaSouth AsiaSouth Asia (IDA & IBRD)South SudanSpainSri LankaSt. Kitts and NevisSt. LuciaSt. Vincent and the GrenadinesSub-Saharan Africa Sub-Saharan Africa (excluding high income)Sub-Saharan Africa (IDA & IBRD countries)SudanSurinameSwazilandSwedenSwitzerlandSyrian Arab RepublicTajikistanTanzaniaThailandTimor-LesteTogoTongaTrinidad and TobagoTunisiaTurkeyTurkmenistanTuvaluUgandaUkraineUnited Arab EmiratesUnited KingdomUnited StatesUpper middle incomeUruguayUzbekistanVanuatuVenezuela, RBVietnamVirgin Islands (U.S.)West Bank and GazaWorldYemen, Rep.ZambiaZimbabwe Timeline:
This timeline shows a graph from 1962 to 2016 of Congo, Dem. Rep.. No data until 1961. Number of actual observations by date: 55.
Source name:
World Development Indicators
Source organization:
World Bank national accounts data, and OECD National Accounts data files.
Categories, topics:
Economy & Growth
Last updated:
apr 23, 2017
Indicators value changes by year
Minimum:
-2.837
jan 1, 1971
Maximum:
26.762K
jan 1, 1995
At the date of observation
Value
Absolute change
Change from previous value
jan 1, 1962
6.099
+6.099
0.0%
jan 1, 1963
21.241
+15.141
248.24%
jan 1, 1964
87.849
+66.608
313.59%
jan 1, 1965
3.548
-84.301
-95.96%
jan 1, 1966
38.952
+35.404
997.87%
jan 1, 1967
4.974
-33.978
-87.23%
jan 1, 1968
58.574
+53.601
1.08K%
jan 1, 1969
59.883
+1.308
2.23%
jan 1, 1970
17.731
-42.152
-70.39%
jan 1, 1971
-2.837
-20.568
-116.0%
jan 1, 1972
8.204
+11.041
-389.17%
jan 1, 1973
10.181
+1.978
24.11%
jan 1, 1974
17.887
+7.706
75.68%
jan 1, 1975
18.238
+0.351
1.96%
jan 1, 1976
12.265
-5.973
-32.75%
jan 1, 1977
57.395
+45.13
367.95%
jan 1, 1978
37.272
-20.124
-35.06%
jan 1, 1979
28.414
-8.857
-23.76%
jan 1, 1980
101.77
+73.356
258.16%
jan 1, 1981
51.408
-50.362
-49.49%
jan 1, 1982
33.23
-18.177
-35.36%
jan 1, 1983
43.485
+10.255
30.86%
jan 1, 1984
78.215
+34.73
79.87%
jan 1, 1985
89.603
+11.388
14.56%
jan 1, 1986
25.811
-63.792
-71.19%
jan 1, 1987
28.453
+2.642
10.24%
jan 1, 1988
73.767
+45.314
159.26%
jan 1, 1989
91.586
+17.819
24.16%
jan 1, 1990
110.262
+18.676
20.39%
jan 1, 1991
108.955
-1.307
-1.19%
jan 1, 1992
2.202K
+2.093K
1.92K%
jan 1, 1993
4.078K
+1.876K
85.19%
jan 1, 1994
1.662K
-2.416K
-59.24%
jan 1, 1995
26.762K
+25.1K
1.51K%
jan 1, 1996
466.407
-26.296K
-98.26%
jan 1, 1997
638.189
+171.782
36.83%
jan 1, 1998
192.643
-445.546
-69.81%
jan 1, 1999
26.935
-165.707
-86.02%
jan 1, 2000
441.902
+414.967
1.54K%
jan 1, 2001
2.63K
+2.188K
495.18%
jan 1, 2002
73.06
-2.557K
-97.22%
jan 1, 2003
31.719
-41.34
-56.58%
jan 1, 2004
13.415
-18.304
-57.71%
jan 1, 2005
6.365
-7.05
-52.55%
jan 1, 2006
29.87
+23.504
369.24%
jan 1, 2007
12.107
-17.763
-59.47%
jan 1, 2008
18.869
+6.762
55.86%
jan 1, 2009
19.585
+0.716
3.79%
jan 1, 2010
33.855
+14.27
72.86%
jan 1, 2011
17.407
-16.448
-48.58%
jan 1, 2012
10.37
-7.037
-40.43%
jan 1, 2013
7.493
-2.876
-27.74%
jan 1, 2014
0.73
-6.764
-90.26%
jan 1, 2015
0.798
+0.068
9.36%
jan 1, 2016
0.643
-0.155
-19.38%
Ranking of countries by current statistics by years


Comments: