29
/
en
AIzaSyAYiBZKx7MnpbEhh9jyipgxe19OcubqV5w
April 1, 2024
206908
Nepal
NPL
true
2
1
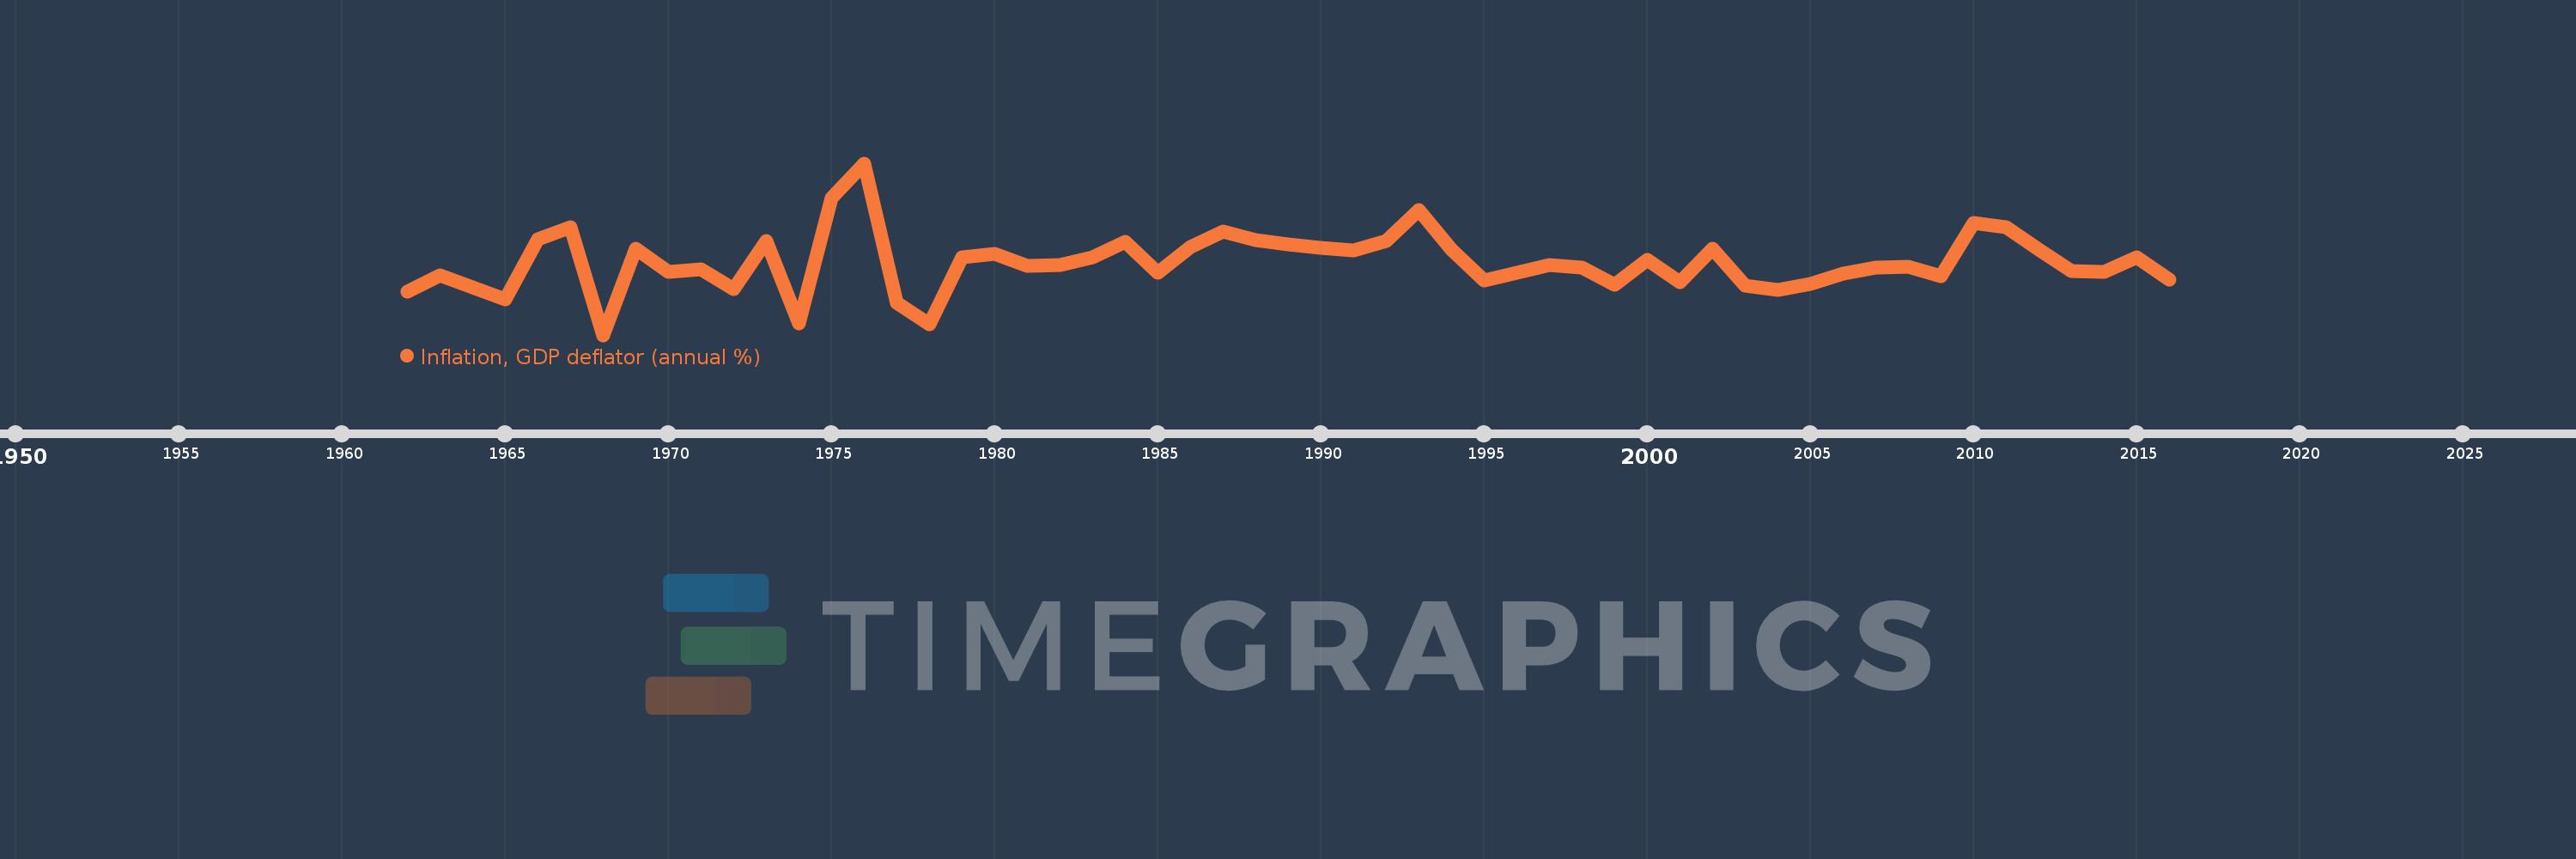
Inflation, GDP deflator (annual %)
2016,2015,2014,2013,2012,2011,2010,2009,2008,2007,2006,2005,2004,2003,2002,2001,2000,1999,1998,1997,1996,1995,1994,1993,1992,1991,1990,1989,1988,1987,1986,1985,1984,1983,1982,1981,1980,1979,1978,1977,1976,1975,1974,1973,1972,1971,1970,1969,1968,1967,1966,1965,1964,1963,1962
This statistics in other country:
AfghanistanAlbaniaAlgeriaAndorraAngolaAntigua and BarbudaArab WorldArgentinaArmeniaArubaAustraliaAustriaAzerbaijanBahamas, TheBahrainBangladeshBarbadosBelarusBelgiumBelizeBeninBermudaBhutanBoliviaBosnia and HerzegovinaBotswanaBrazilBrunei DarussalamBulgariaBurkina FasoBurundiCabo VerdeCambodiaCameroonCanadaCaribbean small statesCayman IslandsCentral African RepublicCentral Europe and the BalticsChadChannel IslandsChileChinaColombiaComorosCongo, Dem. Rep.Congo, Rep.Costa RicaCote d'IvoireCroatiaCubaCyprusCzech RepublicDenmarkDjiboutiDominicaDominican RepublicEarly-demographic dividendEast Asia & PacificEast Asia & Pacific (excluding high income)East Asia & Pacific (IDA & IBRD countries)EcuadorEgypt, Arab Rep.El SalvadorEquatorial GuineaEritreaEstoniaEthiopiaEuro areaEurope & Central AsiaEurope & Central Asia (excluding high income)Europe & Central Asia (IDA & IBRD countries)European UnionFijiFinlandFragile and conflict affected situationsFranceFrench PolynesiaGabonGambia, TheGeorgiaGermanyGhanaGreeceGreenlandGrenadaGuatemalaGuineaGuinea-BissauGuyanaHaitiHeavily indebted poor countries (HIPC)High incomeHondurasHong Kong SAR, ChinaHungaryIBRD onlyIcelandIDA & IBRD totalIDA blendIDA onlyIDA totalIndiaIndonesiaIran, Islamic Rep.IraqIrelandIsle of ManIsraelItalyJamaicaJapanJordanKazakhstanKenyaKiribatiKorea, Rep.KosovoKuwaitKyrgyz RepublicLao PDRLate-demographic dividendLatin America & Caribbean Latin America & Caribbean (excluding high income)Latin America & the Caribbean (IDA & IBRD countries)LatviaLeast developed countries: UN classificationLebanonLesothoLiberiaLibyaLiechtensteinLithuaniaLow & middle incomeLow incomeLower middle incomeLuxembourgMacao SAR, ChinaMacedonia, FYRMadagascarMalawiMalaysiaMaldivesMaliMaltaMarshall IslandsMauritaniaMauritiusMexicoMicronesia, Fed. Sts.Middle East & North AfricaMiddle East & North Africa (excluding high income)Middle East & North Africa (IDA & IBRD countries)Middle incomeMoldovaMonacoMongoliaMontenegroMoroccoMozambiqueMyanmarNamibiaNauruNepalNetherlandsNew CaledoniaNew ZealandNicaraguaNigerNigeriaNorth AmericaNorwayOECD membersOmanOther small statesPacific island small statesPakistanPalauPanamaPapua New GuineaParaguayPeruPhilippinesPolandPortugalPost-demographic dividendPre-demographic dividendPuerto RicoQatarRomaniaRussian FederationRwandaSamoaSan MarinoSao Tome and PrincipeSaudi ArabiaSenegalSerbiaSeychellesSierra LeoneSingaporeSlovak RepublicSloveniaSmall statesSolomon IslandsSomaliaSouth AfricaSouth AsiaSouth Asia (IDA & IBRD)South SudanSpainSri LankaSt. Kitts and NevisSt. LuciaSt. Vincent and the GrenadinesSub-Saharan Africa Sub-Saharan Africa (excluding high income)Sub-Saharan Africa (IDA & IBRD countries)SudanSurinameSwazilandSwedenSwitzerlandSyrian Arab RepublicTajikistanTanzaniaThailandTimor-LesteTogoTongaTrinidad and TobagoTunisiaTurkeyTurkmenistanTuvaluUgandaUkraineUnited Arab EmiratesUnited KingdomUnited StatesUpper middle incomeUruguayUzbekistanVanuatuVenezuela, RBVietnamVirgin Islands (U.S.)West Bank and GazaWorldYemen, Rep.ZambiaZimbabwe Timeline:
This timeline shows a graph from 1962 to 2016 of Nepal. No data until 1961. Number of actual observations by date: 55.
Source name:
World Development Indicators
Source organization:
World Bank national accounts data, and OECD National Accounts data files.
Categories, topics:
Economy & Growth
Last updated:
apr 23, 2017
Indicators value changes by year
Minimum:
-5.668
jan 1, 1968
Maximum:
27.523
jan 1, 1976
At the date of observation
Value
Absolute change
Change from previous value
jan 1, 1962
2.688
+2.688
0.0%
jan 1, 1963
5.897
+3.209
119.39%
jan 1, 1964
3.57
-2.327
-39.46%
jan 1, 1965
1.195
-2.375
-66.53%
jan 1, 1966
12.885
+11.69
978.51%
jan 1, 1967
15.219
+2.334
18.11%
jan 1, 1968
-5.668
-20.886
-137.24%
jan 1, 1969
11.066
+16.733
-295.24%
jan 1, 1970
6.564
-4.502
-40.68%
jan 1, 1971
7.048
+0.484
7.38%
jan 1, 1972
3.172
-3.876
-54.99%
jan 1, 1973
12.503
+9.331
294.14%
jan 1, 1974
-3.397
-15.9
-127.17%
jan 1, 1975
20.826
+24.223
-713.01%
jan 1, 1976
27.523
+6.697
32.16%
jan 1, 1977
0.544
-26.979
-98.02%
jan 1, 1978
-3.565
-4.109
-755.25%
jan 1, 1979
9.371
+12.936
-362.88%
jan 1, 1980
9.978
+0.607
6.48%
jan 1, 1981
7.61
-2.369
-23.74%
jan 1, 1982
7.937
+0.328
4.31%
jan 1, 1983
9.347
+1.41
17.76%
jan 1, 1984
12.289
+2.941
31.47%
jan 1, 1985
6.378
-5.911
-48.1%
jan 1, 1986
11.422
+5.044
79.08%
jan 1, 1987
14.393
+2.971
26.01%
jan 1, 1988
12.697
-1.696
-11.78%
jan 1, 1989
11.815
-0.881
-6.94%
jan 1, 1990
11.258
-0.557
-4.71%
jan 1, 1991
10.716
-0.542
-4.82%
jan 1, 1992
12.545
+1.829
17.07%
jan 1, 1993
18.489
+5.944
47.39%
jan 1, 1994
10.775
-7.714
-41.72%
jan 1, 1995
4.816
-5.959
-55.3%
jan 1, 1996
6.301
+1.485
30.83%
jan 1, 1997
7.823
+1.522
24.16%
jan 1, 1998
7.279
-0.544
-6.95%
jan 1, 1999
4.108
-3.171
-43.57%
jan 1, 2000
8.887
+4.779
116.34%
jan 1, 2001
4.472
-4.415
-49.67%
jan 1, 2002
11.017
+6.545
146.34%
jan 1, 2003
3.935
-7.083
-64.29%
jan 1, 2004
3.07
-0.864
-21.97%
jan 1, 2005
4.166
+1.096
35.7%
jan 1, 2006
6.119
+1.953
46.87%
jan 1, 2007
7.36
+1.241
20.27%
jan 1, 2008
7.603
+0.243
3.31%
jan 1, 2009
5.62
-1.983
-26.09%
jan 1, 2010
15.908
+10.288
183.07%
jan 1, 2011
15.147
-0.761
-4.79%
jan 1, 2012
10.811
-4.336
-28.62%
jan 1, 2013
6.635
-4.176
-38.63%
jan 1, 2014
6.577
-0.058
-0.87%
jan 1, 2015
9.352
+2.775
42.19%
jan 1, 2016
5.074
-4.278
-45.75%
Ranking of countries by current statistics by years


Comments: